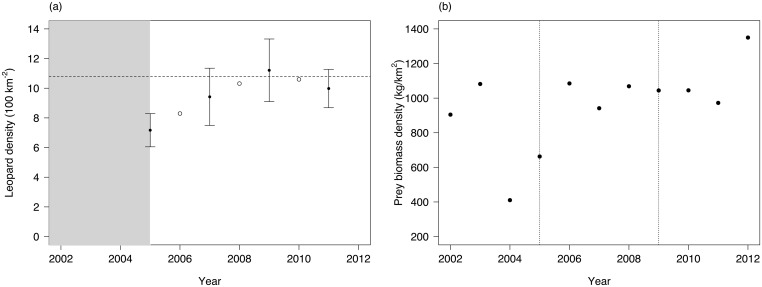
Fig 2. Leopard density and prey biomass estimates, Phinda Private Game Reserve, South Africa, 2002–2012.
(a) Photographic capture-recapture leopard density estimates (solid black dots) with standard error and interpolated values (open circles). Grey zone indicates disturbance period when leopards in Phinda GR underwent negative population growth, before the implementation of conservation protocols in 2005. Horizontal dashed line indicates putative carrying capacity at mean leopard density at the core of the population [21]; (b) combined yearly estimates of nyala, impala and warthog biomass derived from aerial count data in Phinda GR, 2002–2012. Fine-dotted lines show in 2005 the implementation of conservation protocol following leopard population decline, and in 2009 the time when the leopard population reached putative carrying capacity [21].

