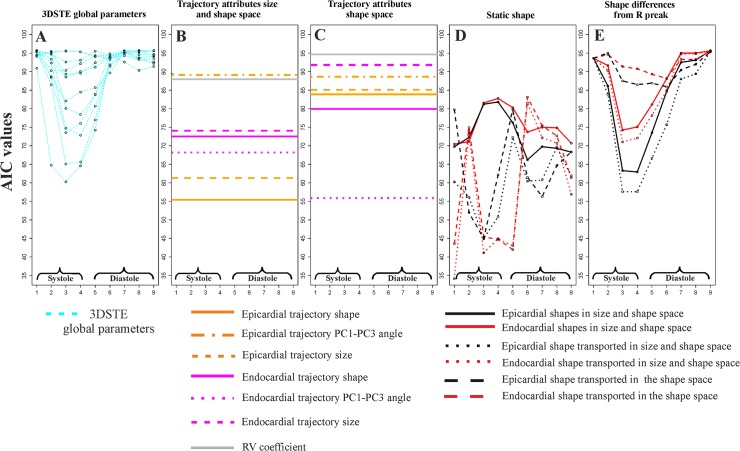
Fig 7. Results of logistic regressions using Control/HCM as a binary response and the entire bulk of morphological parameters used in this study.
The y-axis always represents the Akaike Information Criterion value for any analysis, while the x-axis represents the nine homologous times. Smaller AICs indicate the best models. (A) STE global parameters; corresponding p-values can be found in Table 3. (B) Trajectory attributes in the size and shape space; as these attributes are proper of the entire shape trajectory they are not referred to any particular homologous time; corresponding p-values can be found in Table 5. (C) Trajectory attributes in the shape space: as these attributes are proper of the entire shape trajectory they are not referred to any particular homologous time; corresponding p-values can be found in Table 5. (D) LV static shape analyses using pure shapes, shape transported in the size and shape space and shapes transported in the shape space; corresponding p-values can be found in Table 4. (E) Shape differences from the R peak for the same types of parameters in D; corresponding p-values can be found in Table 4. Among static parameters we found that global longitudinal displacement is the best traditional descriptor at end systolic homologous time. Differences of pure epicardial shapes from R peak perform nearly in the same way. Static shapes (pure shapes in size and shape space, shapes transported in the size and space and shapes transported in the shape space), instead, are performing also in diastole. Endocardial shapes transported in both size and shape space and shape space show the lowest AICs. The courses of transported shapes and pure shapes follow inverse patterns. All trajectory attributes returned significant logistic regressions (Table 5) except for endocardial trajectory size and RV coefficient, both computed in the shape space.

