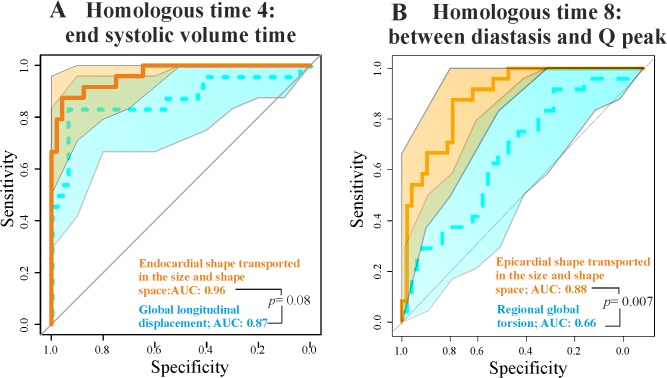
Fig 8. ROC curves for the best STE descriptors and our best static morphometric descriptors in systole and diastole.
(A) Endocardial shape transported in the size and shape space vs. global longitudinal displacement. (B) Epicardial shape transported in the size and shape space vs. regional global torsion. Shaded areas represent the 95% of confidence interval for ROC curves. The p-values refer to the Delong test for differences in ROC prediction.

