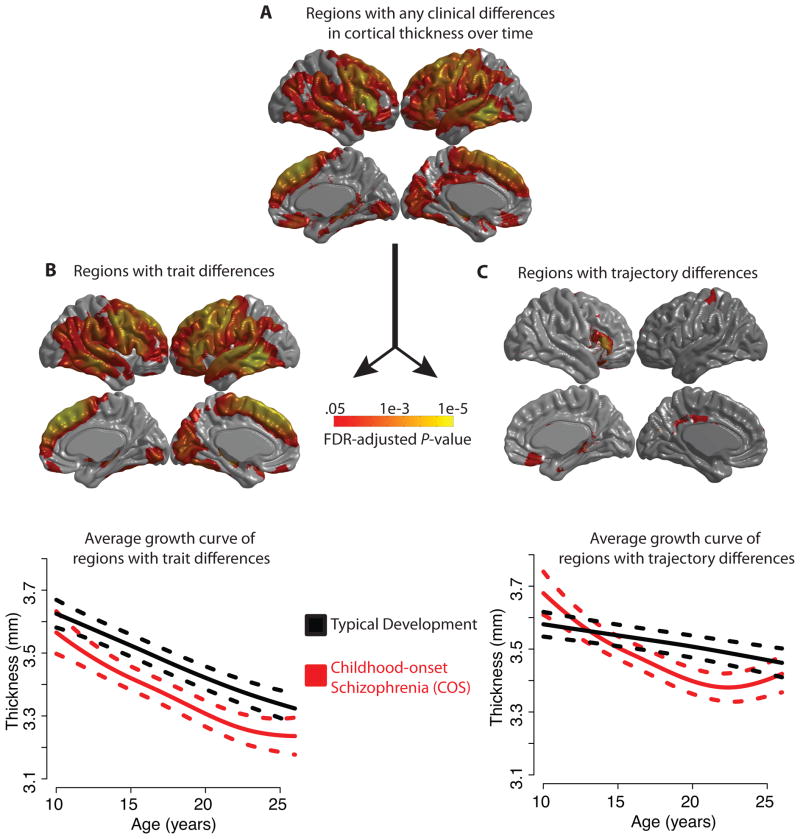
Figure 3. Abnormalities of growth curves in childhood-onset schizophrenia (COS) for each of the ~80,000 cortical vertices, using penalized spline models and FDR-adjusted p-values.
A) Cortical regions with any difference in the maturational trajectory in COS, either a constant trait difference or an age-varying trajectory difference. In other words, the null hypothesis H0, that βv (age) in equation (2) is identically zero, is rejected. B) Regions for which the null hypothesis H0a that in equation (3) is rejected. All of these regions are in fact thinner in COS. The plot below shows the average maturational trajectory of these regions with 95% confidence intervals. C) Regions with significant group differences in trajectory, i.e., the null hypothesis H0b that (age) is identically zero in equation (3) is rejected. The plot below shows the average maturational trajectory of these regions with 95% confidence intervals.

