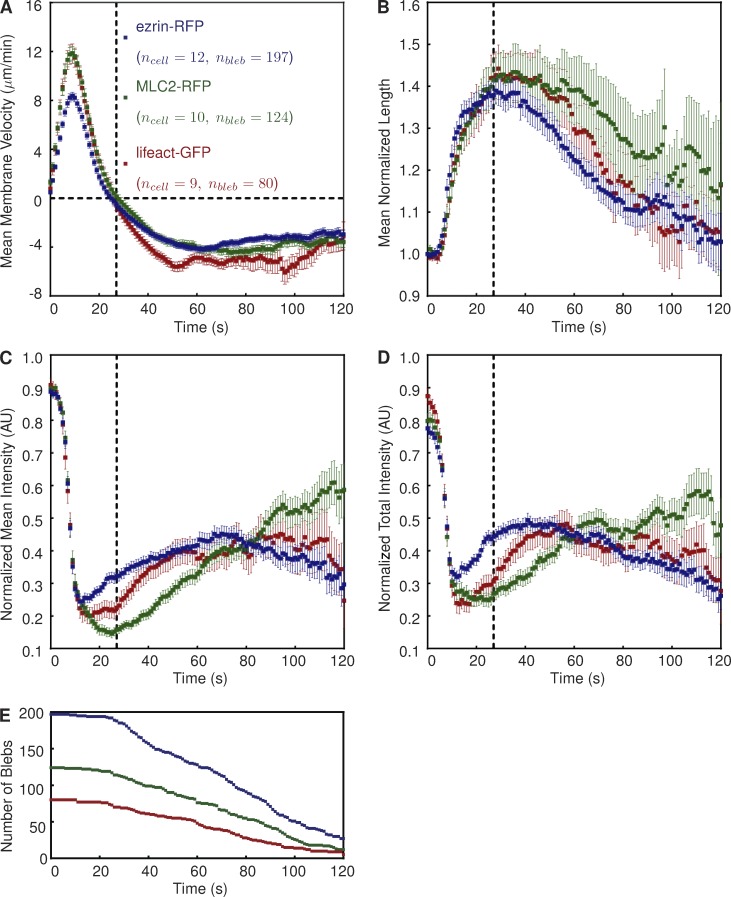
Figure 8.
Description of a “typical” bleb in vaccinia-infected, blebbing HeLa cells. (A–D) Graphs show mean bleb velocity (A), mean normalized bleb perimeter length (B), normalized mean fluorescence intensity (C), and normalized mean fluorescence intensity (D) of the indicated protein. Positive and negative velocity values are indicative of extension and retraction, respectively. Fluorescence intensities are normalized to signal strength in the cortex before bleb formation. The dotted vertical line at t = 27 s indicates the onset of bleb retraction. Error bars represent standard error of the mean. The number of blebs (nbleb) indicates the population size at t = 0. (E) The number of blebs used to derive the mean curves depicted in A–D over time. AU, arbitrary unit.

