Figure 5.
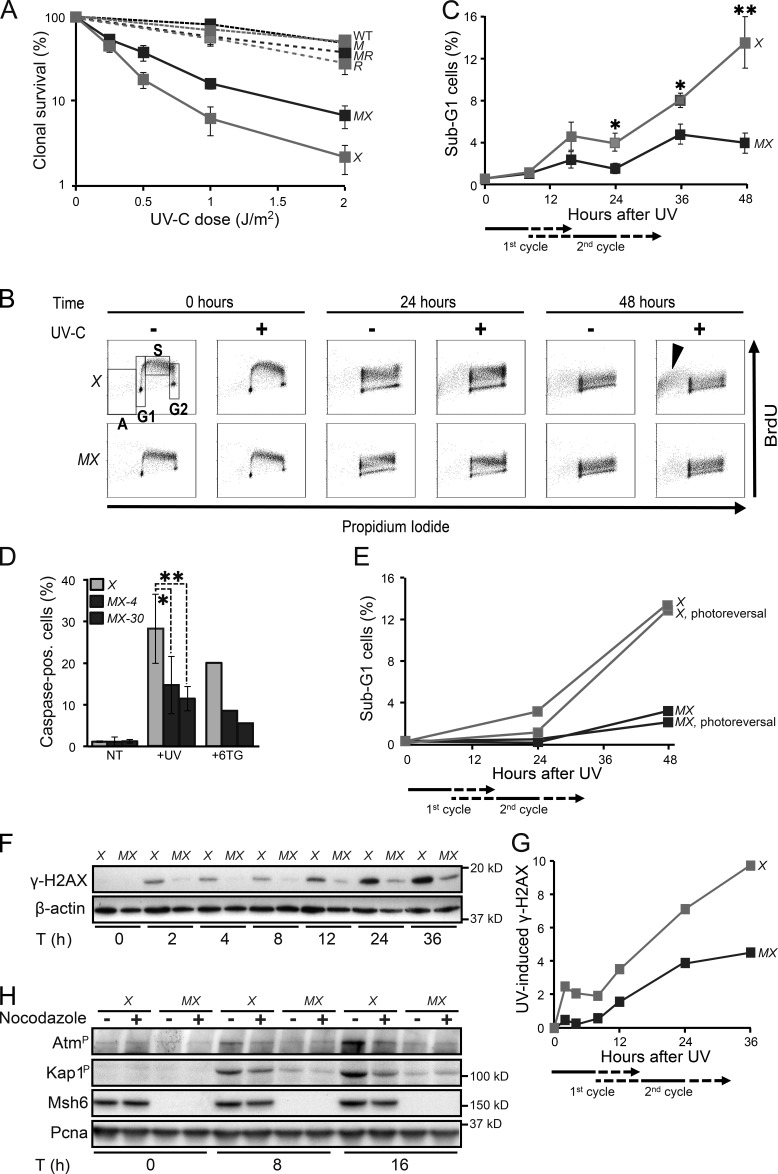
Msh2/Msh6-dependent delayed apoptotic responses to UVC. (A) Clonal survival of ES cell lines used in this study in response to UVC. M, Msh6−/−; X, Xpa−/−; MX, Msh6−/−Xpa−/− line 4; R, Rev1B/B; MR, Msh6−/−Rev1B/B. Lines represent averages from three independent experiments. (B) Bivariate cytometry of cell cycle progression in isogenic ES cell lines after exposure to 0.75 J/m2 UVC or mock treatment, followed by pulse labeling with BrdU, at later time points. Cells were analyzed for DNA content (propidium iodide staining) and for cell cycle progression (BrdU staining). A, sub-G1 fraction; G1, G1 phase; S, early S phase; G2, late S/G2/M phase. Arrowhead, late-appearing sub-G1 population. See Fig. S4 for an independent experiment. X, Xpa−/−; MX, Msh6−/−Xpa−/− line 4. 10,000 cells were analyzed per data point. (C) Quantification of sub-G1 fractions (fractions A; Fig. 5 B). The progression of cells to the second cell cycle after treatment is deduced from the dilution of the BrdU signal (see also Figs. S2 and S4). X, Xpa−/−; MX, Msh6−/−Xpa−/− line 4. Lines represent averages from three independent experiments. (D) Identification of apoptotic cells by staining for activated caspases. Two independent Msh6−/−Xpa−/− ES cell lines (4 and 30) were tested. 6-thioguanine (6TG) was used as a positive control for the induction of delayed apoptosis by canonical MMR (Mojas et al., 2007). X, Xpa−/−; MX-4 and MX-30, Msh6−/−Xpa−/− lines 4 and 30, respectively. One experiment is shown from three independent experiments. (E) UVC (0.75 J/m2)-induced apoptosis is not mitigated by photoreversal of CPD. X, Xpa−/−; MX, Msh6−/−Xpa−/− line 4. One representative experiment is shown from three independent experiments. (F) Immunoblot displaying γ-H2AX levels in adherent cells upon UVC treatment (0.75 J/m2). β-actin, internal standard. X, Xpa−/−; MX, Msh6−/−Xpa−/− line 4. One representative experiment is shown from three independent experiments. G. Quantification of the Immunoblot depicted in Fig. 5F. The signals for γ-H2AX were normalized with respect to the corresponding signals for β-actin. X, Xpa−/−; MX, Msh6−/−Xpa−/− line 4. H. Msh2/Msh6-dependent induction of the dsDNA breaks markers phospho-Atm and phospho-Kap1 during the second cell cycle after low-dose (0.75 J/m2) UVC treatment. PCNA, internal standard. X, Xpa−/−; MX, Msh6−/−Xpa−/− line 4. One representative experiment is shown from three independent experiments.

