Figure 6.
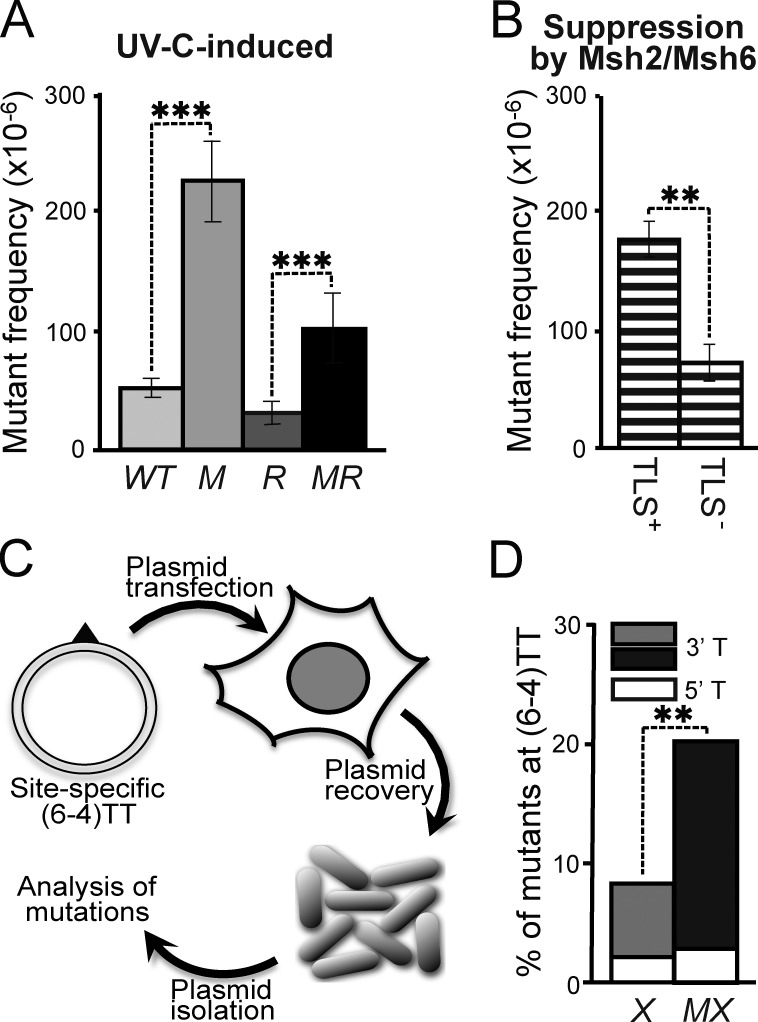
Epistasis of mutagenic TLS and Msh2/Msh6. (A) UVC (2 J/m2)-induced mutant frequencies in isogenic WT, Msh6−/− (M), Rev1B/B (R), and Msh6−/−Rev1B/B (MR) ES cells. Bars represent averages from three independent experiments. (B) Msh2/Msh6-dependent suppression of UVC-induced mutant frequencies in Rev1-proficient (TLS+) and Rev1B/B (TLS−) ES cells, derived from A. Frequencies were calculated by subtraction of induced mutant frequencies in Rev1B/B cells from those in Rev1B/BMsh6−/− cells in each individual experiment, followed by averaging. (C) In vivo assay to quantify mutagenic TLS at a site-specific (6–4)TT (triangle) on a transfected replicating plasmid. (D) Mutant frequencies at the 5′ and the 3′ thymidines of a site-specific (6–4)TT in NER-deficient (Xpc−/−) mouse embryonic fibroblast lines in the presence (X) or absence (MX) of Msh2/Msh6. Bars represent averages from two experiments (see Fig. S5).

