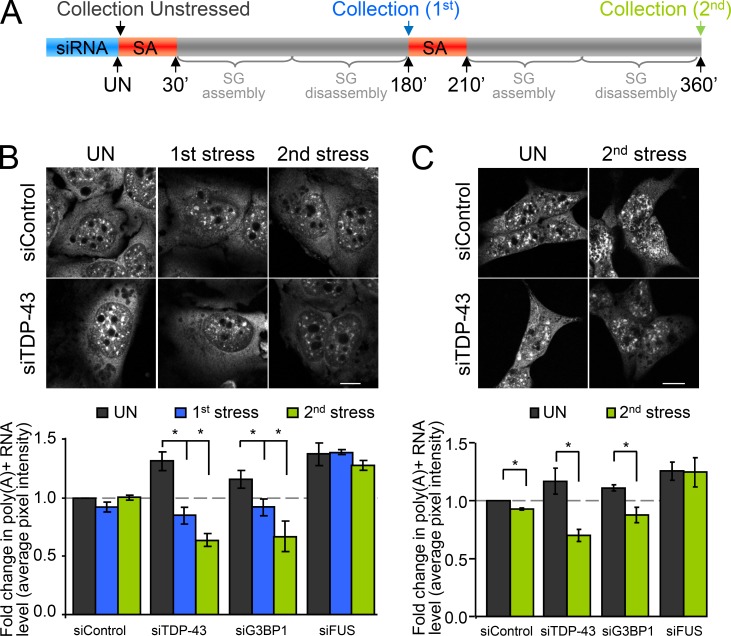
Figure 5.
Decreased mRNA preservation after stress exposure. (A–C) Cells were transfected with the indicated siRNAs for 72 h and then subjected to two consecutive rounds of stress response induced by SA (SG assembly and disassembly). Coverslips were collected before stress, and after the first and the second round of SG assembly/disassembly. Polyadenylated mRNA was visualized via FISH with an oligo(dT) probe. (A) Experimental design. (B) Representative images of HeLa cells labeled with an oligo(dT) probe and quantification of total pixel intensity. (C) Representative images and quantification of a similar experiment performed in SH-SY5Y cells and examined only after the second SA stress exposure. All data are representative of >3 independent experiments and plotted as the mean ± SEM (error bars). *, P < 0.05. Bars, 10 µm.

