Figure 6.
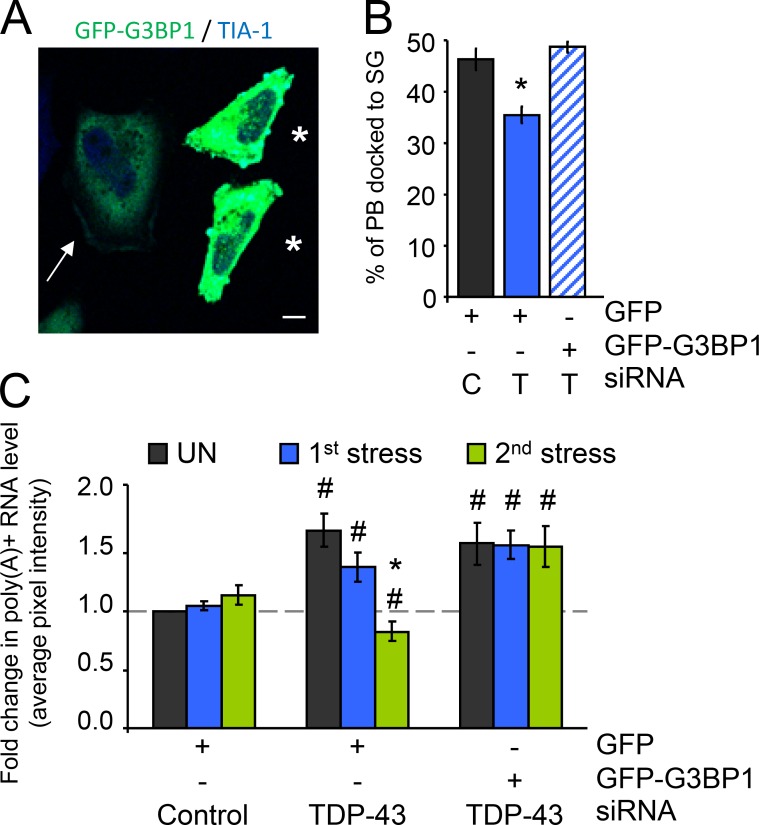
G3BP1 rescues SG–PB interactions and maintains polyadenylated mRNA levels. (A–C) HeLa cells transfected with control (C) or TDP-43 (T) siRNA for 48 h and transfected with GFP or G3BP1-GFP for 24 h, then treated with SA. (A) Representative confocal micrograph demonstrating low-level transient expression of G3BP1. The arrow indicates a typical example of a low-expressing cell that was quantified. Asterisks indicate cells with high levels of G3BP1 expression that were excluded from the analysis. Bar, 10 µm. (B) Coverslips were collected before and at 90 min after stress and then labeled for Dcp1a and TIA-1 to follow PBs and SGs, respectively. Docking was quantified as before in low fluorescence GFP-expressing cells. (C) Cells were subjected to two consecutive rounds of stress response induced by SA (SG assembly and disassembly). Coverslips were collected before stress, and after the first and second rounds of stress. Polyadenylated mRNA was visualized via FISH with a oligo(dT) probe and quantified as before. All data are representative of ≥3 independent experiments and plotted as the mean ± SEM (error bars). *, P < 0.05 compared with unstressed siControl; #, P < 0.05 compared with unstressed of the same sample.

