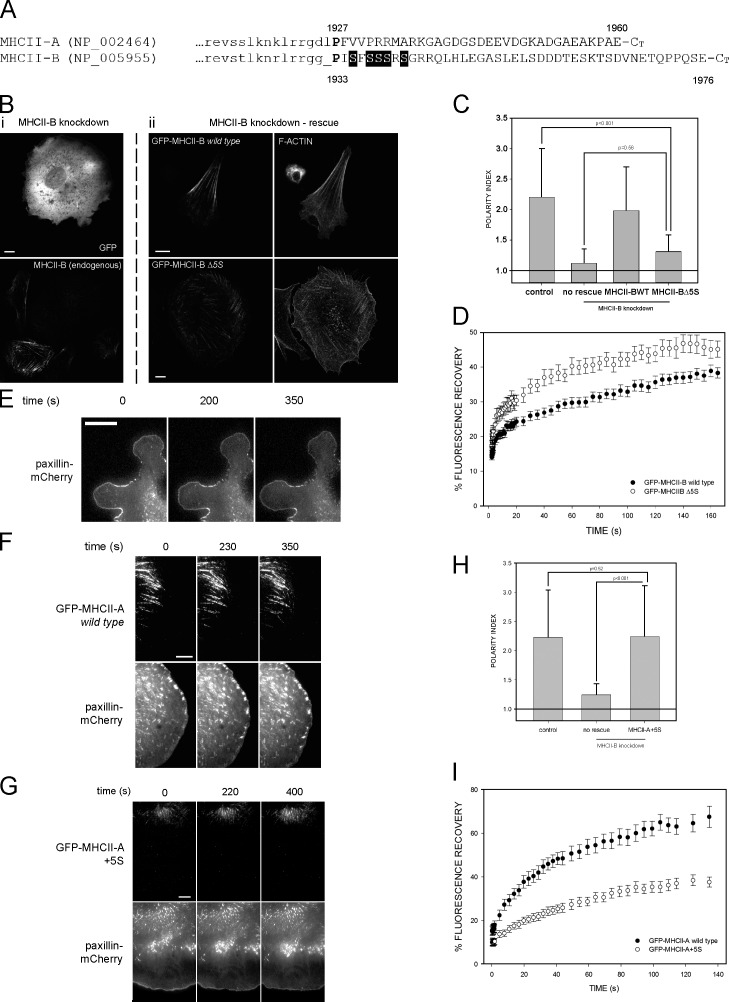
Figure 1.
The 1935–1941 amino acid region of MHCII-B determines the dynamics of NMII. (A) Alignment of the nonhelical domains of human MHCII-A and MHCII-B. Lowercase, last amino acids of the coiled-coil domain. Uppercase, nonhelical tail domain. P in bold is the domain-breaking proline. Shaded background, 1935–1941 motif. (B, left column [i]) MHCII-B–depleted CHO.K1 cells expressing GFP (top) and stained for endogenous MHCII-B (bottom). (middle and right columns [ii]) MHCII-B–depleted cells expressing shRNA-resistant GFP–MHCII-B (wild type; top row) or GFP–MHCII-B Δ5S (bottom row). (middle column) GFP; (right column) F-actin. Representative examples are shown. (C) Polarity index of MHCII-B–depleted cells rescued or not rescued with wild-type or Δ5S GFP–MHCII-B. Polarity index is calculated as indicated in Materials and methods. Data are the means ± SD of >200 cells from four independent experiments; p-value is the significance according to Mann–Whitney’s test. (D) FRAP curves of wild type and Δ5S GFP–MHCII-B. Data are the means ± SEM of 24 individual measurements per condition in four independent experiments. (E–G) Snapshots of TIRF microscopy time-lapse videos of MHCII-A–depleted CHO.K1 cells transfected with paxillin-mCherry alone (no rescue; E), or cotransfected with paxillin-mCherry and wild-type GFP–MHCII-A (rescue; F) or GFP–MHCII-A+5S (G), plated on fibronectin, and allowed to attach for 45 min. Images were obtained every 5 s. Note the lack of elongated adhesions in protrusions in E and G, and the different distance of the GFP-labeled, wild-type (F), and MHCII-A+5S (G) filaments to the paxillin-decorated leading edge. Images extracted from Videos 1–3. (H) Polarity index of MHCII-B–depleted cells rescued or not rescued with the MHCII-A+5S mutant. Data are the means ± SD of >200 cells from four independent experiments. (I) FRAP curves of wild-type GFP–MHCII-A and GFP–MHCII-A+5S. Data are the means ± SEM of 28 individual measurements per condition in four independent experiments. Bars, 10 µm.

