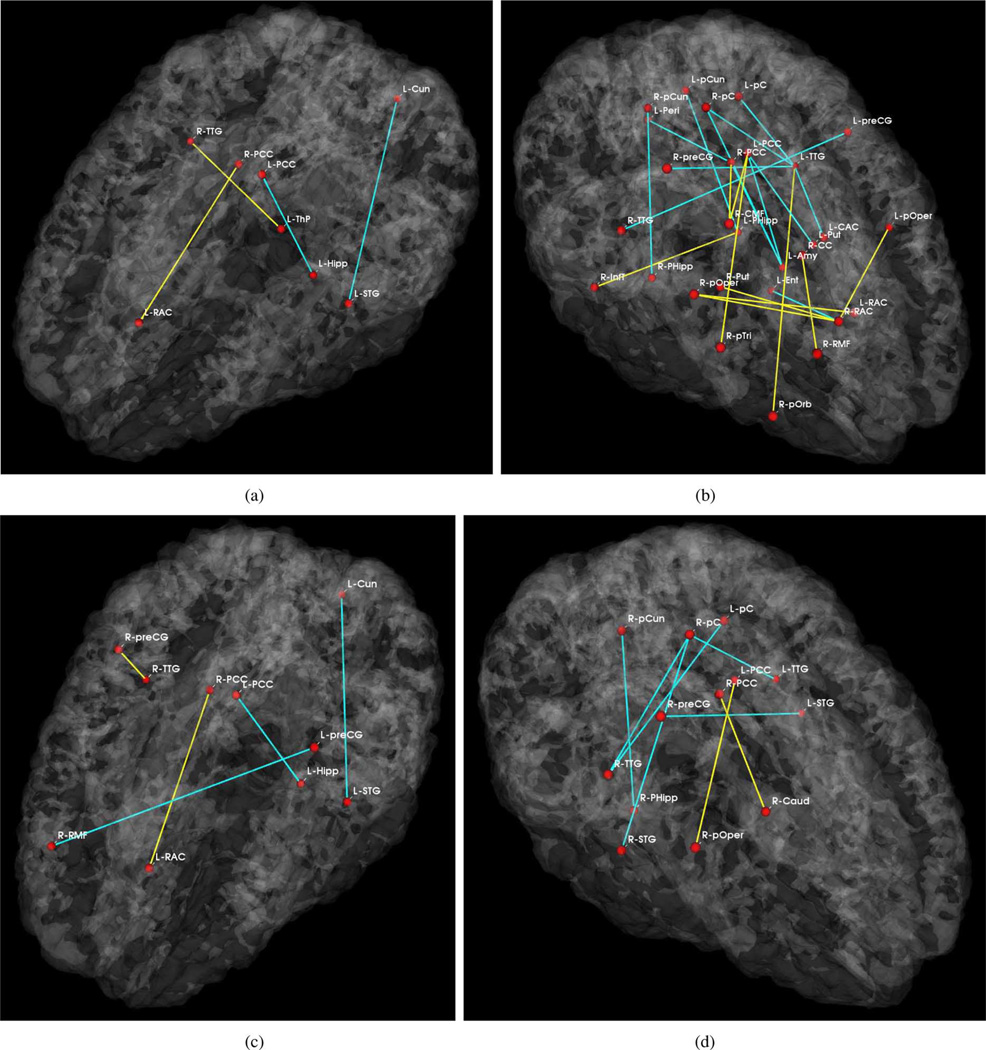
Fig. 9.
Significant anatomical and functional connectivity differences (p < 0.05 and ). Blue lines indicate higher connectivity in the control group; yellow lines indicate higher connectivity in the schizophrenia population. (a), (b) Derived from the joint DWI/fMRI model. (c) Significant anatomical connections from the DWI-only model. (d) Significant functional connections from the fMRI-only model. (a) Joint Model, Anatomical. (b) Joint Model, Functional. (c) DWI-only Model. (d) fMRI-only Model.

