
Figure 7.
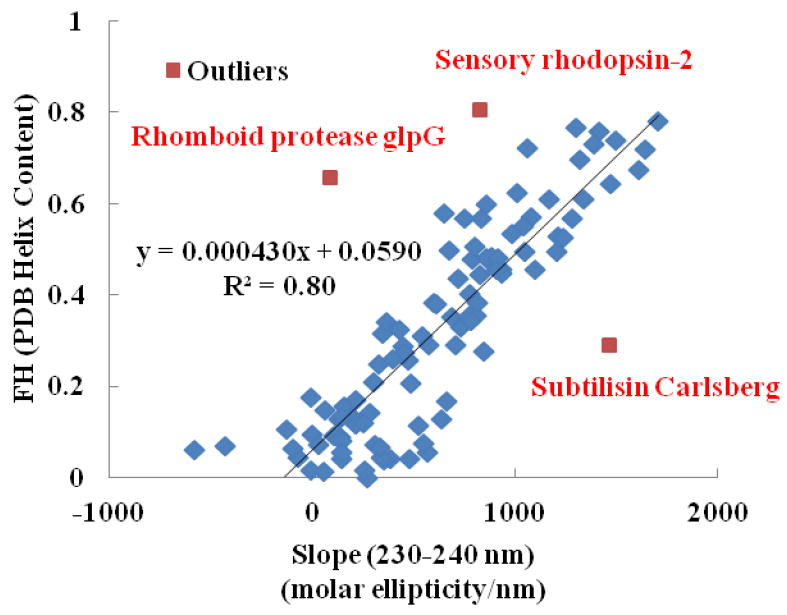
Correlation between the empirical parameter ‘A’ (i.e., the slope of the CD spectrum over the wavelength range from 230-240 nm) and the fractional helicity (FH) estimated using the DSSP [47] for the proteins within the SP175 and MP 180 CD reference sets from the Protein CD Data Bank (PCDDB). [6, 41, 43-45] Outlier data points (indicated in red along with the name of the protein), which were identified using the Studentized–Residual method, [48] have been excluded from the dataset for the calculation of the linear regression line.