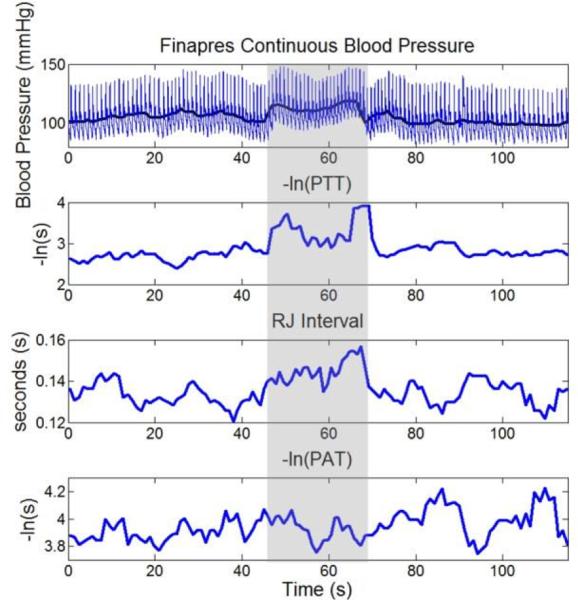
Fig. 5.
Top panel: Finapres continuous BP data before, during, and after a Valsalva maneuver. The bold line corresponds to MAP. 2nd panel: -ln(PTT), averaged over 5 beats showing qualitative correlation to MAP. 3rd panel: RJ Interval during the maneuver averaged over 5 beats. 4th panel: -ln(PAT), averaged over 5 beats not showing significant qualitative correlation to MAP due to the change in PEP moving in the opposite direction as PTT. The shaded regions correspond to the Valsalva maneuver.

