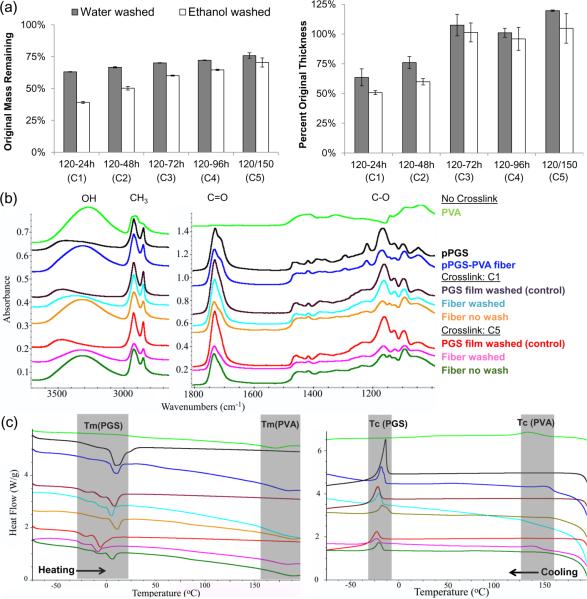
Figure 3.
Purification analysis. (a) Percent of unwashed mass and thickness remaining after water and ethanol washes for each crosslinking conditions. (b) ATR-FTIR spectra of PVA, PGS and PGS-PVA during purification. (c) Heating and cooling curves from DSC measurements. Colors use the same legend as (b).

