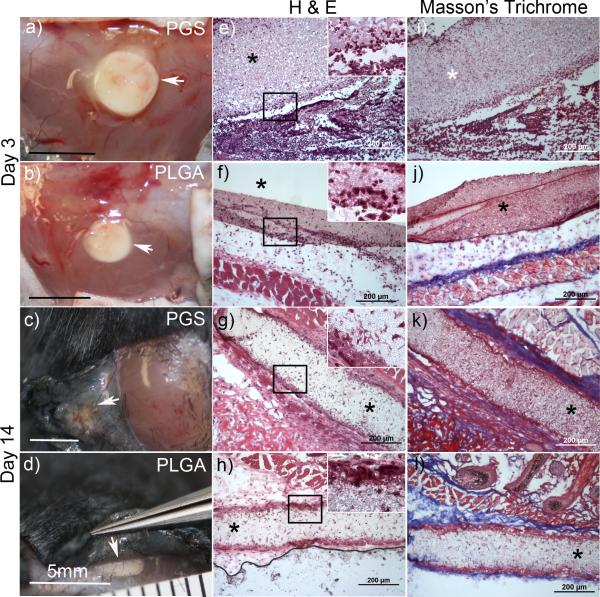
Figure 6.
Gross and histological images of fibrous PGS and PLGA implants after 3 and 14 days. Implants are indicated by arrowheads in gross images (a-d) of the subcutaneous tissue. Cross-sectional images stained by (H&E) are shown in (e-h) and Masson's trichrome (i-l) with implants indicated by an asterisk.

