
Figure 1.
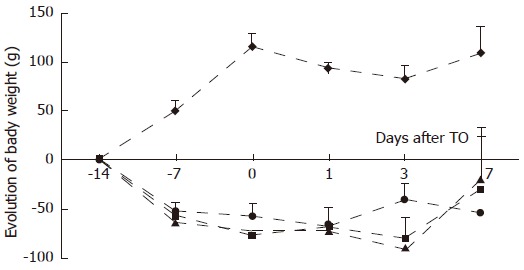
Evolution of body weight from initial weight as a function of time during the feeding period and at each time point studied after turpentine oil (TO) injection (arrow) for control (CG; ), protein-restricted (PR; ), glutamine (Gln; ) and protein-powder (PP; ) groups. Values are means ± SD. P < 0.05, between CG and other groups from d-7 until d7.