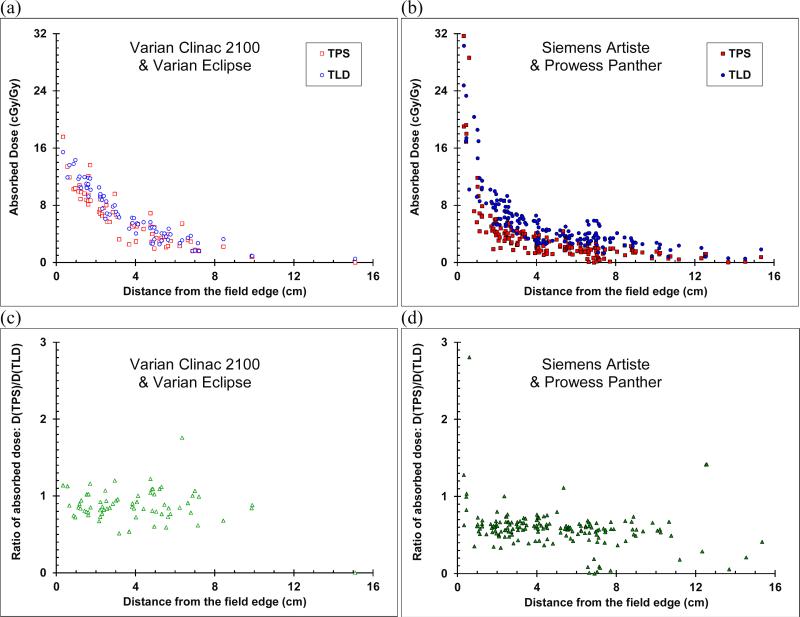
Figure 4.
Out-of-field absorbed dose versus distance from the field edge for the CSI of an anthropomorphic phantom, calculated by the TPS (red squares) and measured with TLDs (blue circles) for (a) the clinic at MD Anderson and (b) the clinic at AUBMC. The ratio of dose calculated by the TPS to dose measured by the TLD (green triangles) (c) at MD Anderson and (d) at AUBMC. For clarity, error bars were not plotted. Uncertainties in values are given in the text in section 2.3.

