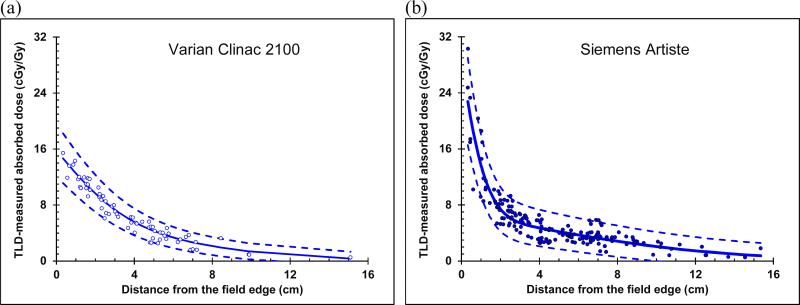
Figure 5.
Out-of-field absorbed dose (blue circles) versus distance from the field edge for the CSI of an anthropomorphic phantom measured with TLDs overlaid by the double-Gaussian model fit (blue line) to the data, with upper and lower confidence limits (blue dashed lines) for (a) the measurement at MD Anderson and (b) the measurement at AUBMC.

