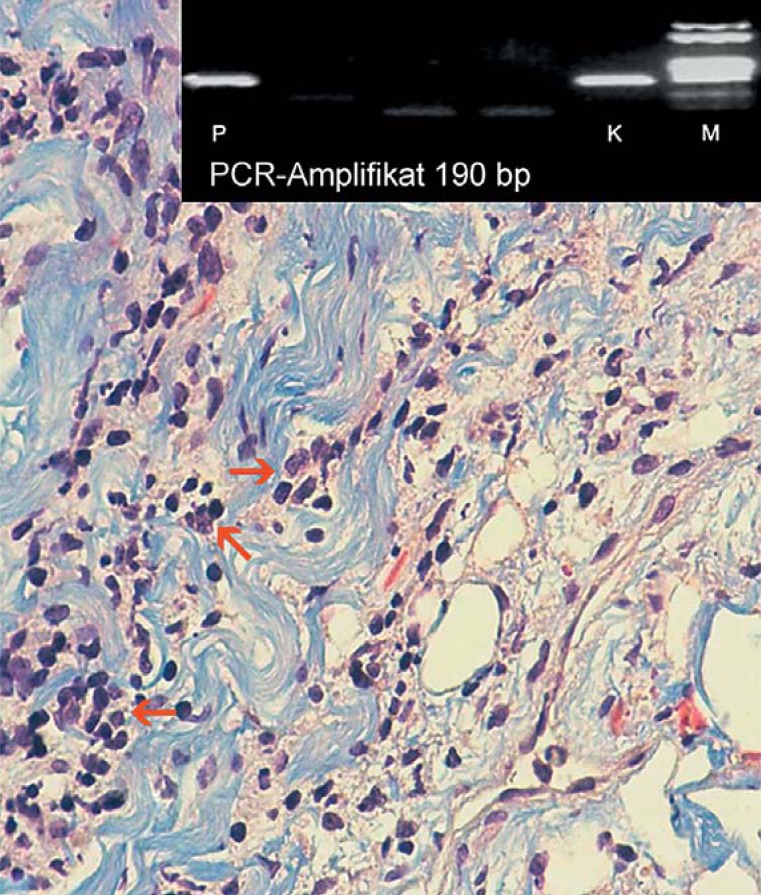
Figure 3.
Histology of endomyocardial biopsy from a patient with Lyme carditis: Polymerase chain reaction (PCR) band pattern (top insert in the image) with patient specimen (P) on the left. Identification of Borrelia burgdorferi DNA (ospA gene region, PCR amplificate of 190 bp as a bright band), control (K) on the right with corresponding band on the same height, and size standard (M) on the far right. Histopathological appearance of lymphocytic myocarditis (red arrows) with significant subendocardial fibrosis (stained blue) and pathogen persistence correspond to stage II of Lyme disease (Masson’s trichrome stain, x 400)

