
Figure 5.
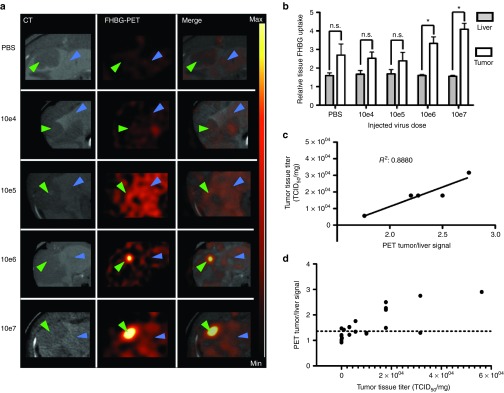
Recombinant VSV-HSV1-sr39tk can be detected by PET from 1 × 10⁶ injected pfu on day 1 after application. (a) PET/CT scans of rats bearing orthotopic HCCs in axial view. One representative example of every treatment group is shown in high contrast-enhanced CT, PET and merged signal. Arrow heads indicate tumor (green) and liver (blue). PET intensity scale is set to 2 × 10⁴ Bq/ml at maximum value and 5 × 10³ Bq/ml at minimum value. (b) Semiquantitative analysis of tracer accumulation in regions of interest (ROI) from PET/CT scans. Data are expressed as mean with SEM of the relative FHBG uptake (Groups: PBS n = 2; 1 × 10⁴ n = 2; 1 × 10⁵ n = 4; 1 × 10⁶ n = 3; 1 × 10⁷ n = 2). Stars indicate significance with P values lower than 0.01 (*). (c) Correlation analysis of tumor-to-liver ROI ratios to intratumoral virus titer (TCID50/mg). Only animals of groups, which showed significant tumor-to-liver ratios, have been analyzed for correlation. Goodness of fit was determined with R2 = 0.8880. (d) Intratumoral virus titer (pfu/mg) versus PET tumor/liver signal of all animals. Dotted line (y = 1.33) indicates background signal (mean + SD) of PBS-treated animals (n = 6).