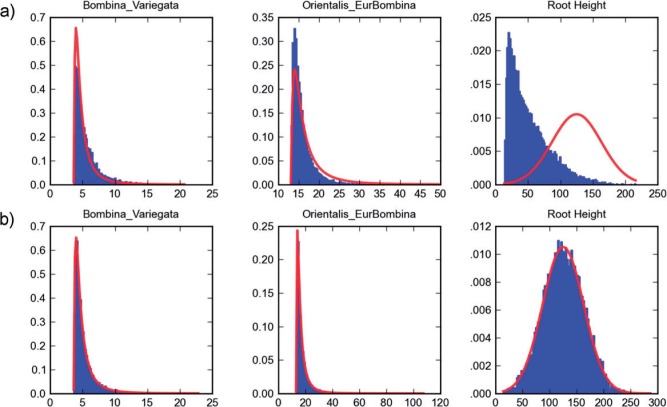
Figure 5.
Three calibrations for Bombina. Three calibration densities for the Bombina analysis, a) under BEAST multiplicative calibration prior and b) under the conditional prior. Each sub-figure shows the density for calibration times (myr), where specified calibration densities are in red, and the induced prior from a BEAST run are in blue. The three fossil calibrations from left to right are for the western Bombina (lognormal distribution with and , offset by 3.6 myr), the small Bombina (lognormal with and , offset by 13), and for the root (normal distribution with mean 125 and standard deviation of 38).

