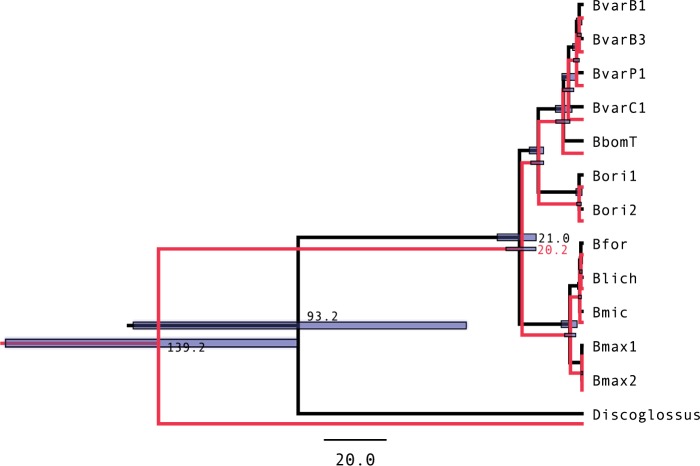
Figure 6.
Summary trees for Bombina analysis. Summary tree from the multiplicative-prior analysis (in black) and the conditional prior (in red). The trees were generated from the posterior using the Common Ancestor method (CAT), which produces the most accurate divergence estimates (Heled and Bouckaert 2013).

