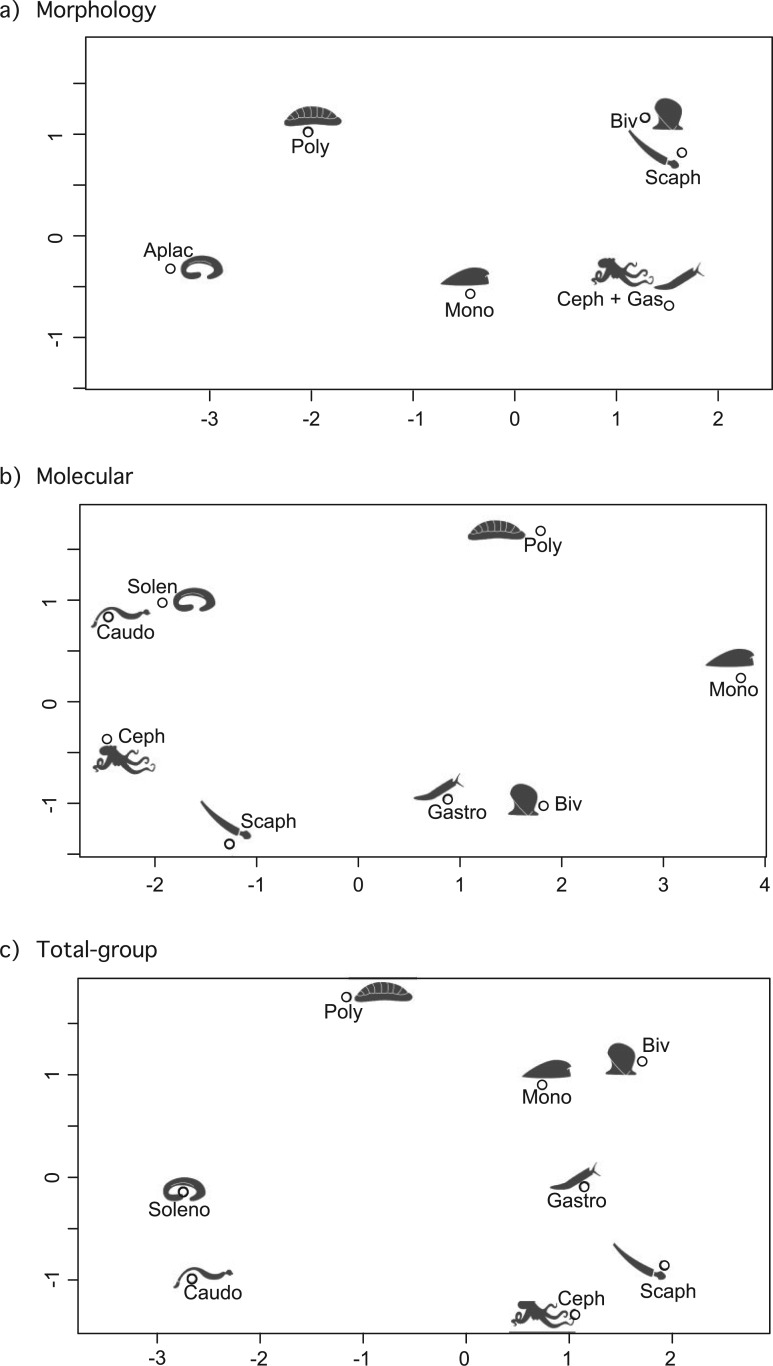
Figure 3.
Multidimensional scaling plot of median internodal distances separating the eight molluscan classes (e.g., sister taxa are separated by one node). The space across the plot, noted by the two axes, can be read as the number of nodes separating any pair of taxa across a hypothetical tree for total group Mollusca.

