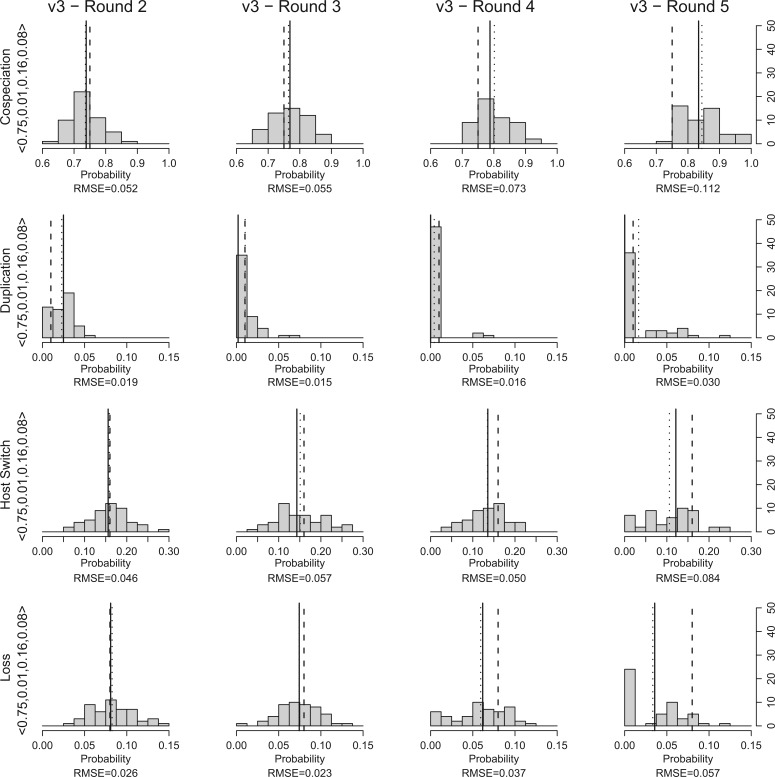
Figure 4.
For each simulated data set, we ran Coala 50 times and, at the end of each round (from 2 to 5), we took note of the cluster whose representative parameter vector had the smallest distance to the probability vector used to generate the simulated data set. The histograms show the distribution of the event probabilities observed on the list of parameter vectors which have the smallest distance on each run for the data set . The solid and dotted vertical lines indicate median and mean values, respectively. The dashed vertical line indicates the “target” value.

