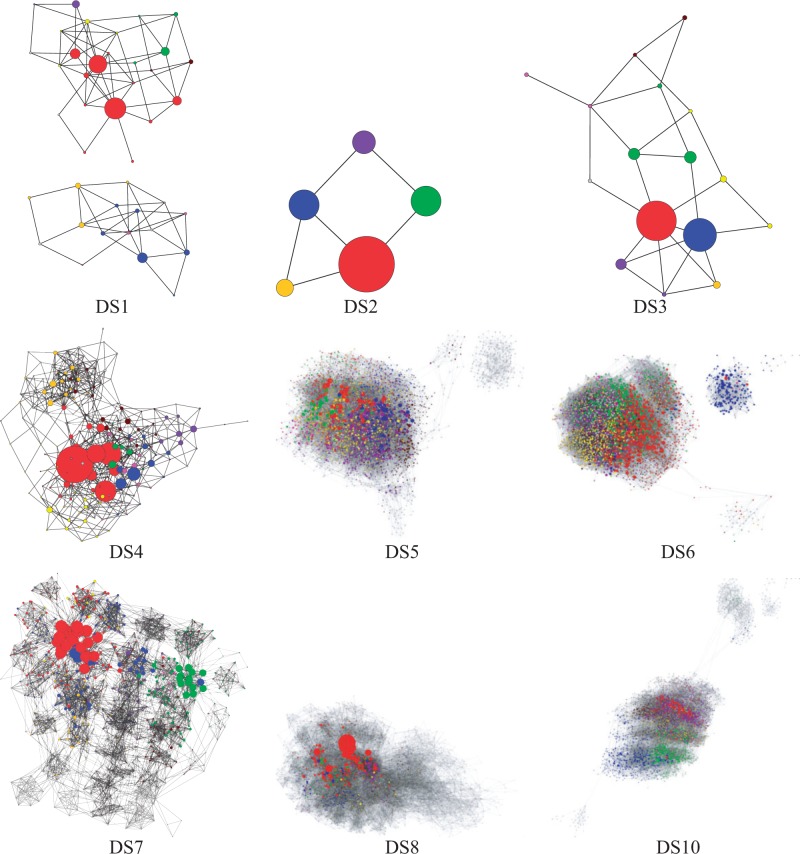
Figure 3.
Cluster SPR graphs of the combined golden run eukaryote posteriors. Each graph contains either the 95% credible set or the 4096 topologies with highest PP (DS5, DS6, and DS10). Nodes are scaled relative to posterior probability within each graph (but not with respect to the other graphs). Nodes are colored by SPR-based descending PP clusters (gray scale in the print version).

