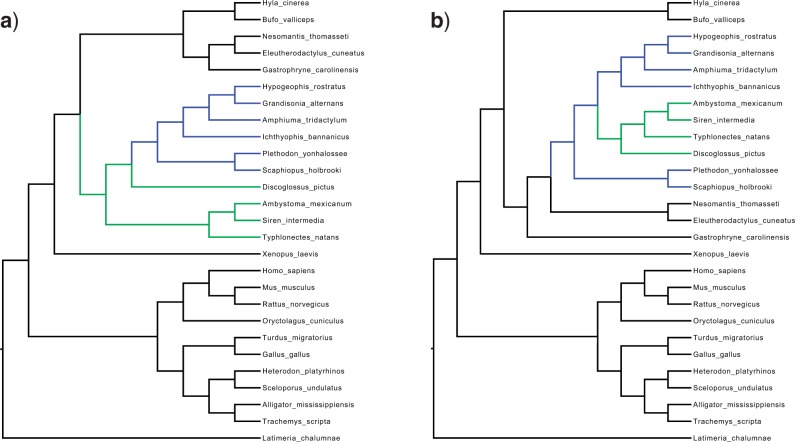
Figure 4.
Central trees of the two topological peaks in data set DS1. Only two SPR operations separate these trees, moving the blue (gray in the print version) and then green (light gray) clade to traverse from peak 1 to peak 2 and vice versa in the reverse direction. However, the sole intermediate topology is so unlikely that it was never visited in any of our tests, inducing a severe topological bottleneck. Longer paths through multiple trees outside of the 95% confidence interval are taken instead, resulting in long transit times between the peaks.

