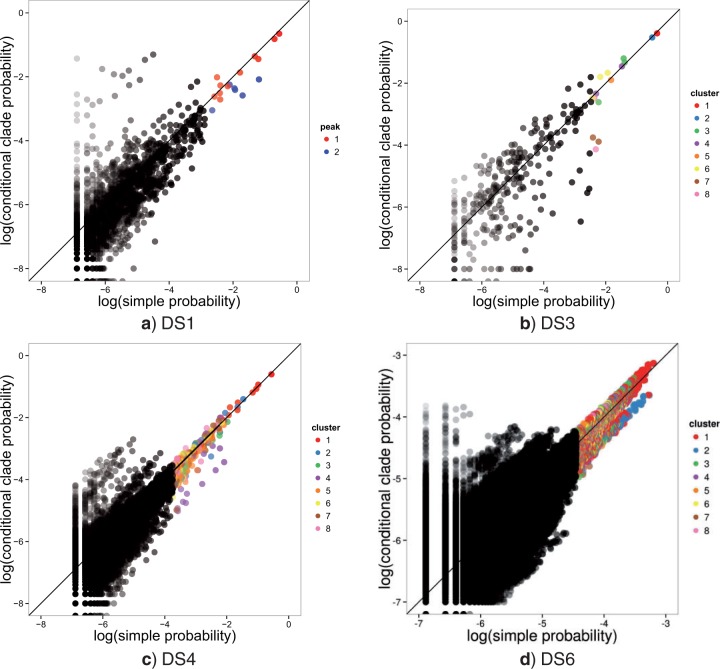
Figure 8.
A comparison of posterior probability and CCD estimates for the aggregated golden runs on data sets DS1, DS3, DS4, and DS6. Probability is shown on a log-log scale in base 10. The top trees for each data set are colored by peak in DS1 and cluster for the other data sets. Transparency of points increases as posterior probability decreases.

