
Figure 1. Stimulus effects on Gamma oscillations.
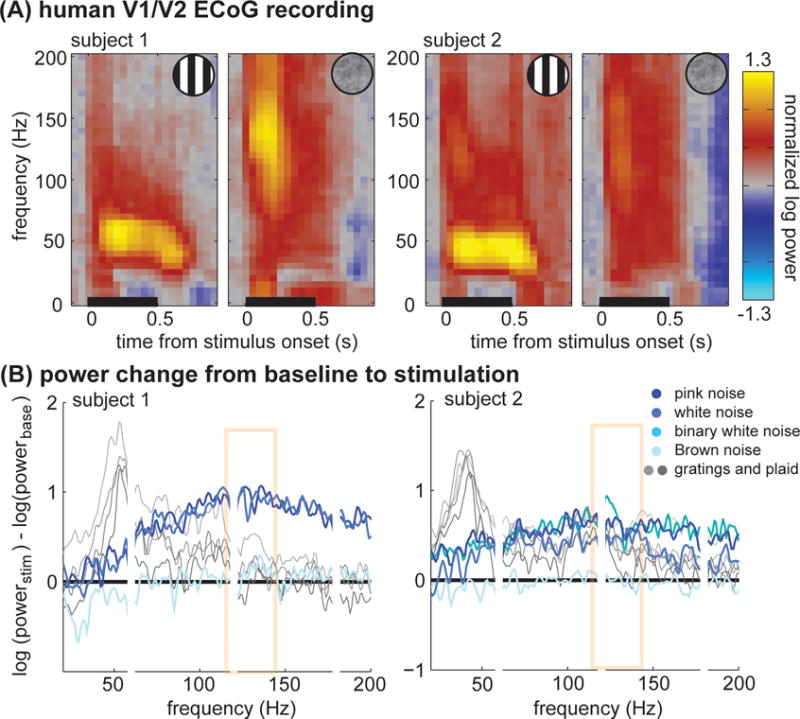
(A) Power changes from baseline from ECoG recordings in human V1/V2, plotted as a function of time and frequency. Grating stimuli elicit large, sustained gamma oscillations around 50 Hz. In higher frequencies (above 80Hz), a transient response is present. Noise stimuli elicit a different pattern of responses. Narrowband gamma oscillations from 30–80 Hz are not evident. In higher frequencies (above 80Hz), both a large transient and a smaller sustained response are present. Adapted from Figure 1 of [3].
(B) Plots of spectral power change from baseline for several stimuli. The Brunet et al. article [5] argues that the power changes from baseline show a convincing spectral peak around 130Hz for noise patterns. This area is highlighted in yellow. Adapted from Figure 2 of [3].