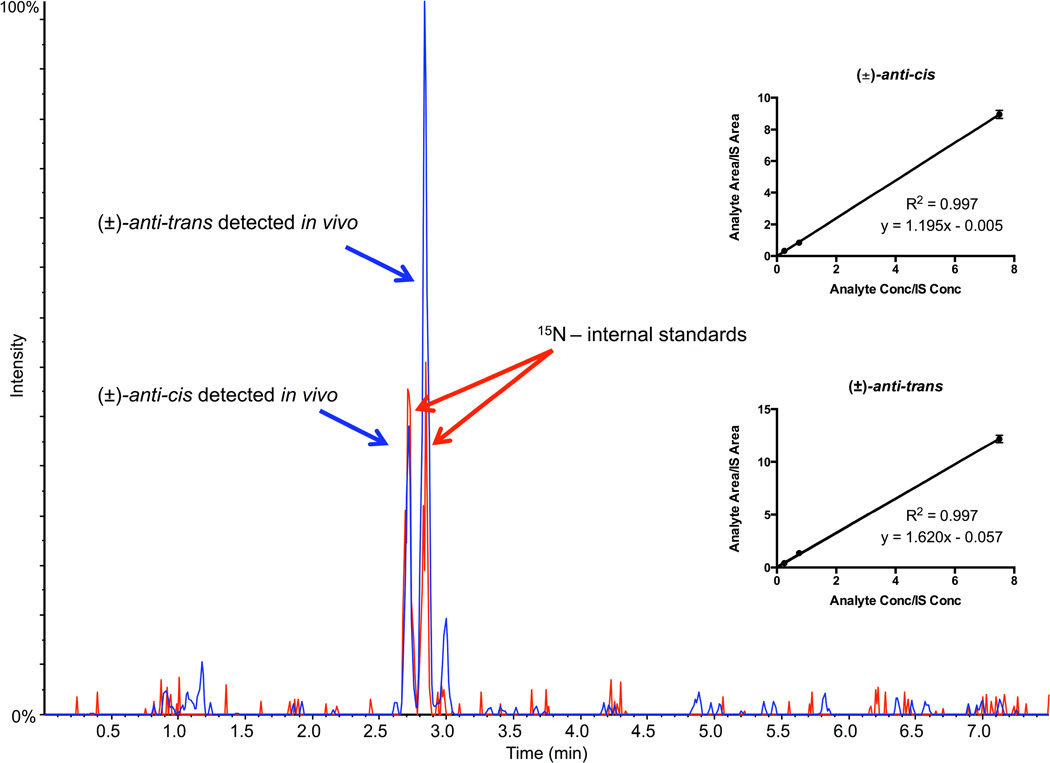
Figure 3. Representative MRM chromatogram of (±)-anti-DBCDE-dA adducts obtained from mice orally exposed to 10 mg/kg DBC for 5 days and euthanized 3 days after final exposure.
The chromatogram shows separation of major adducts (±)-anti-cis-DBCDE-dA and (±)-anti-trans-DBCDE-dA using the 7.5-minute stable-isotope dilution UPLC-MS/MS method. The blue peaks represent the target adducts (m/z 604.2 → m/z 335.0) detected in vivo, while the red peaks represent the spiked 15N-labeled (±)-anti-cis-DBCDE-dA and (±)-anti-trans-DBCDE-dA internal standards (m/z 609.2 → m/z 335.0). Figure insets represent linear calibration curves for each (±)-anti-cis-DBCDE-dA and (±)-anti-trans-DBCDE-dA adduct.

