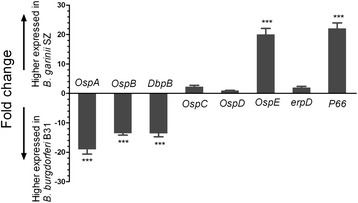
Figure 4.

Expression profiles of genes encoding Borrelia membrane proteins detected by qRT-PCR. Each bar represents the fold change of gene expression in B. garinii SZ vs. B. burgdorferi B31. Expression levels were nomalized to that of flaB, and levels in B. burgdorferi B31 were used to calculate fold change based on a mean of three biological replicates. Bars above and below the x-axis show genes that are up- and downregulated, respectively, in B. garinii SZ. ΔΔCt values were analyzed with the Student’s t test. *P < 0.05, **P < 0.01, ***P < 0.001.
