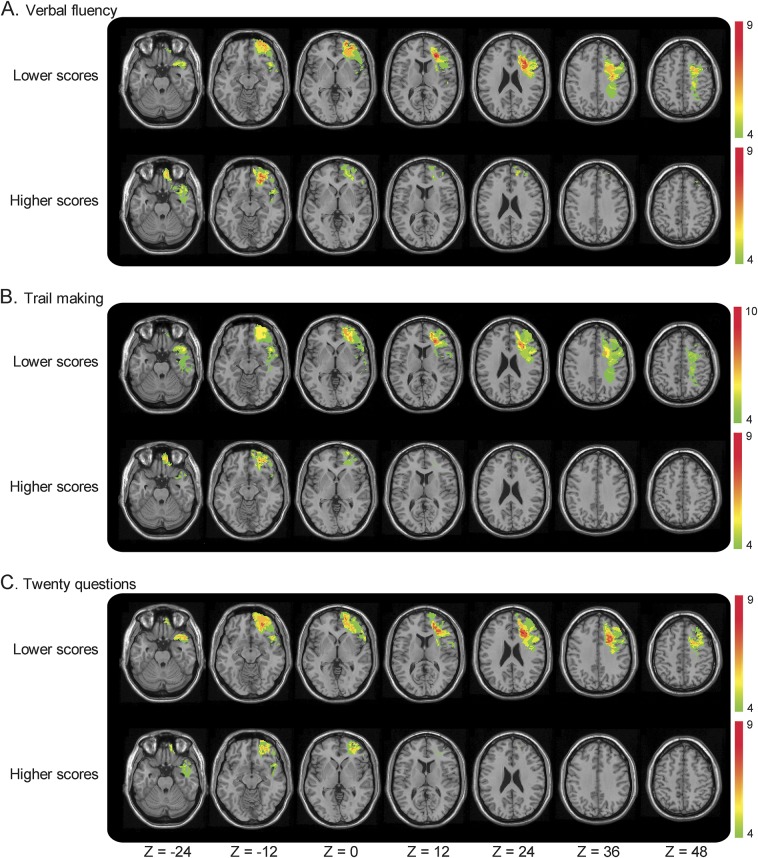
Figure 2. Median split subgroup lesion overlaps in left prefrontal cortex lesions group according to executive function scores.
The left prefrontal cortex lesions group subdivided according to their test score on the (A) Verbal Fluency, (B) Trail Making, and (C) Twenty Questions test. The lower performing penetrating traumatic brain injury group had wider network of gray and white matter damage compared to higher performing individuals. Color denotes the number of patients with overlapping lesion at each voxel. Red indicates the highest density of lesion overlap subjects and blue indicates the least density of lesion overlap. The results are overlaid onto an MRI template brain in Montreal Neurological Institute space for visualization purposes. Images are shown in radiologic convention: the right hemisphere is shown on the reader's left side.

