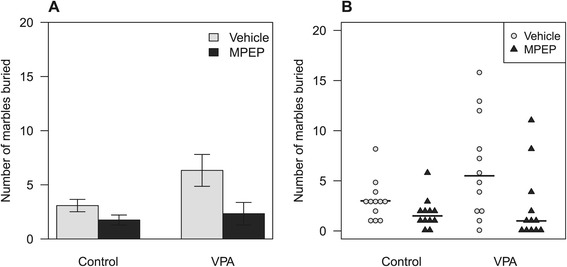
Figure 3.

Marble burying test data.(A) Data from the marble burying test are displayed with a typical mean ± SEM graph, and (B) with all the data plotted, which highlights the skewness, unequal variances, and the discrete and bounded nature of the values. Horizontal lines are the medians.
