. 2015 Apr 14;4:e05042. doi: 10.7554/eLife.05042

Figure 3. Testing the threshold model.

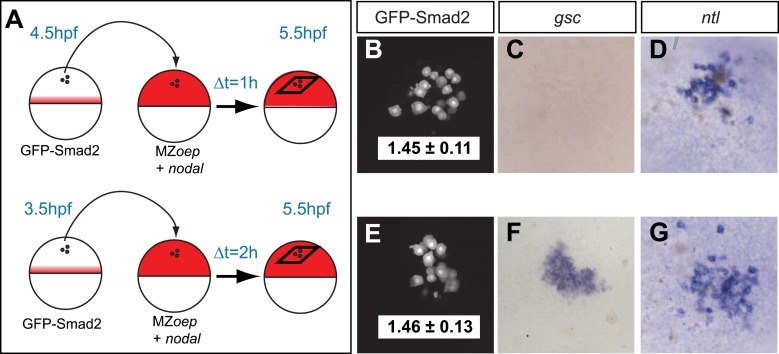
(A) Schematic of the transplantation experiment. Animal pole cells (black circles) from a GFP-Smad2 transgenic embryo were transplanted into the animal pole of a host embryo that had been injected with mRNA for squint, a zebrafish Nodal gene (red). Host cells were unresponsive to Nodal because they were maternal-zygotic mutants for one-eyed pinhead (MZoep), a cell surface protein required for Nodal signaling. This strategy prevents feedback loops and restricts target gene expression to donor cells. The developmental age of donor cells was matched to host embryos. Black parallelograms indicate imaging plane in subsequent panels. (BG) Nodal signaling response of donor cells after 1 hr (BD) or 2 hr (EG) of exposure to Nodal. (B and E) Projection of confocal stacks of transplanted embryos and associated NC ratio (mean ± std). Activated Smad2 levels are similar in both cases. See Figure 3—figure supplement 1 for time course of GFP-Smad2 N/C ratio. (C and F) RNA in situ hybridization for gsc. (D and G) RNA in situ hybridization for ntl. ntl is expressed after 1 (n = 12/12) or 2 hr (n = 16/16) of Nodal exposure while gsc signal in transplanted cells is only detected after 2 hr of exposure (n = 1/15 at 1 hr, n = 12/14 after 2 hr). Images in BG are from different embryos. Note that the differences in the duration of Nodal exposure uncouple the activated Smad2 level from target gene expression.

DOI: http://dx.doi.org/10.7554/eLife.05042.011

Figure 3.

Figure 3—figure supplement 1. Time course of GFP-Smad2 NC ratio.

Figure 3—figure supplement 1.

Boxplot of the NC ratio of GFP-Smad2 cells over time. GFP-Smad2 cells (n ∼50) were transplanted into a MZoep host embryo injected with 30 pg of squint mRNA (as in Figure 3A, bottom panel), and the NC ratio was determined at different time intervals. Note that the NC ratio is never higher at any time between 3.5 and 5.5 hpf than as compared to 5.5 hpf.
Figure 3—figure supplement 2. Testing the ratchet model.

Figure 3—figure supplement 2.

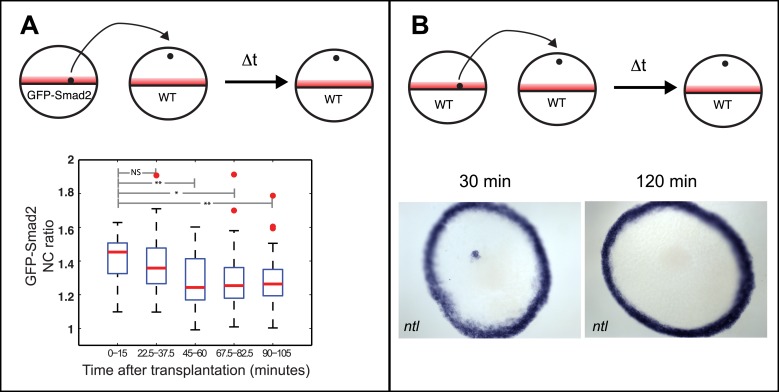
(A) Top: Illustration of transplantation experiments to move cells from a region with Nodal (red) to a region without Nodal. Cells located at the margin of a 30% epiboly GFP-Smad2 transgenic embryo were transplanted to the animal pole of a stage-matched wild-type embryo. The NC ratio of GFP-Smad2 was measured over time by time-lapse microscopy (n = 3 embryos). Bottom: boxplot of the NC ratio distribution at different time intervals after transplantation. Smad2 activity progressively decreases and reaches basal levels after 60 min. Two-sample t-tests p-values are indicated: NS, not significant; *p ≤ 0.05; **p ≤ 0.01. (B) Top: Illustration of the transplantation experiment. Bottom: RNA in situ hybridization for ntl 30 min (left) or 120 min (right) after marginal cells were transplanted to the animal pole. After 30 min, the majority of ectopically transplanted marginal cells express ntl (n = 12/14 transplantations) whereas 2 hr after transplantation, 90% of embryos are devoid of ectopic ntl expression (n = 17/19 transplantations). These results indicate that Nodal pathway activity cannot be maintained for prolonged periods in the absence of Nodal.