. 2015 Apr 14;4:e05042. doi: 10.7554/eLife.05042

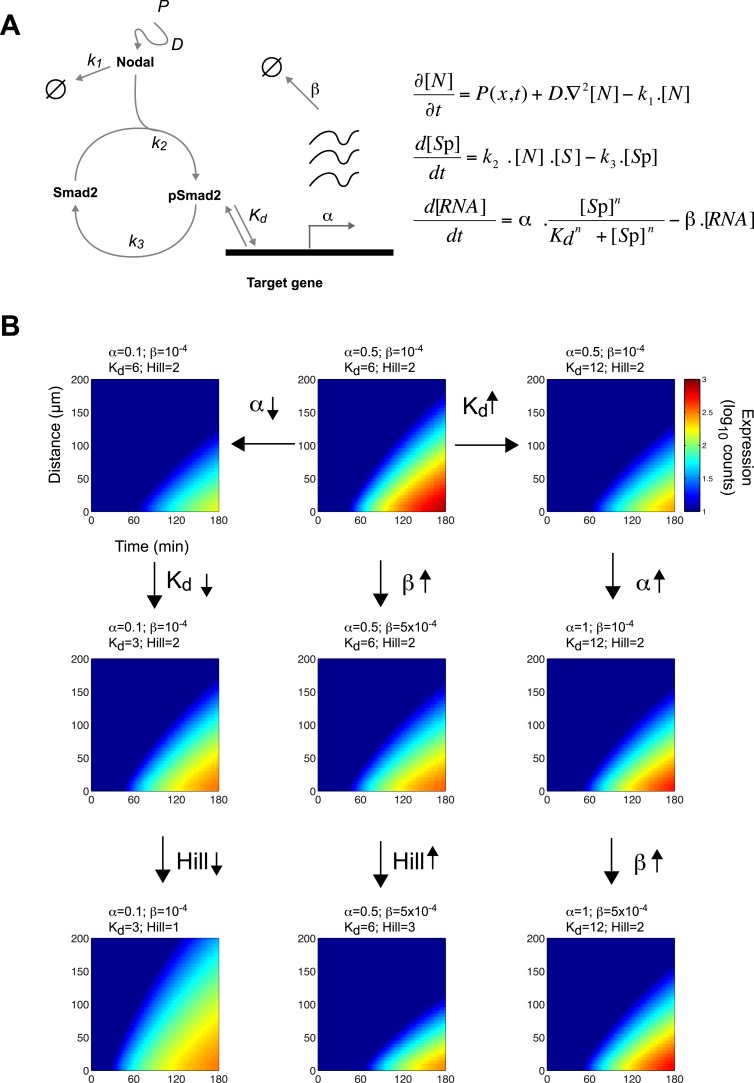
Figure 4. A kinetic model for Nodal morphogen interpretation.

(A) Diagram of the Nodal signaling pathway used for modeling (left) and coupled differential equations describing the changes of Nodal, activated Smad2 and target genes over time (right). The Nodal ligand is locally produced, diffuses and via kinase receptors phosphorylates Smad2. Phosphorylated Smad2 acts as a transcription regulator and binds to target genes to induce transcription. (B) Spatiotemporal gene expression patterns were simulated over 3 hr using the kinetic model. Each panel depicts the expression pattern resulting from a unique combination of the four free parameters involved in mRNA production (transcription rate α, degradation rate β, dissociation constant Kd and Hill coefficient) while other parameters are held constant. Note how changes in these parameters change the range of target gene expression. See Figure 4—figure supplement 1 for more extensive simulations.

DOI: http://dx.doi.org/10.7554/eLife.05042.014

Figure 4.

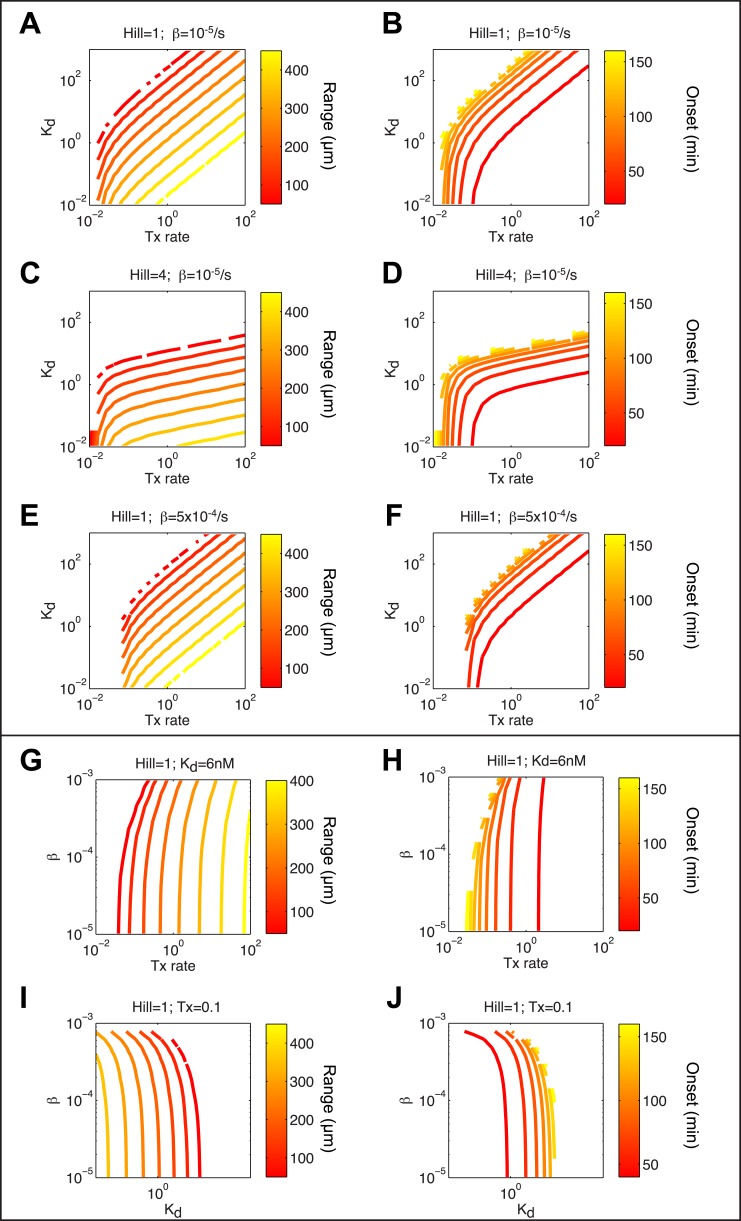
Figure 4—figure supplement 1. Screening for parameters regulating range and onset of target gene expression.

Figure 4—figure supplement 1.

(A, C, E, G, I) Contour plots of maximum range of expression after 3 hr of signaling. (B, D, F, H, J) Contour plots of onset of expression. (A and B) Combined effect of Tx rate (x axis) and Kd (y axis) with a Hill coefficient of 1 and a degradation rate of 10−5 s−1. Tx rate and Kd contribute equally to the range of expression, except at low Kd and low Tx rate, where the range is more sensitive to changes in Tx rate. (C and D) Combined effect of Tx rate (x axis) and Kd (y axis) with a Hill coefficient of 4 and a degradation rate of 10−5 s−1. The range becomes more sensitive to changes in Kd and less sensitive to changes in Tx rate. (E and F) Combined effect of Tx rate (x axis) and Kd (y axis) with a Hill coefficient of 1 and a degradation rate of 5 × 10⁻⁴ s−1 (G and H) Combined effect of Tx rate (x axis) and degradation rate (y axis) with a Hill coefficient of 1 and Kd of 6 nM. Range and onset of expression are only sensitive to changes in degradation rates when RNA half-life is very short (half life <30 min). (I and J) Combined effect of Kd (x axis) and degradation rate (y axis) for a Hill coefficient of 1 and Tx rate of 0.1 count/s. Range and onset of expression are only sensitive to changes in degradation rates when RNA half-life is very short (half life <30 min).