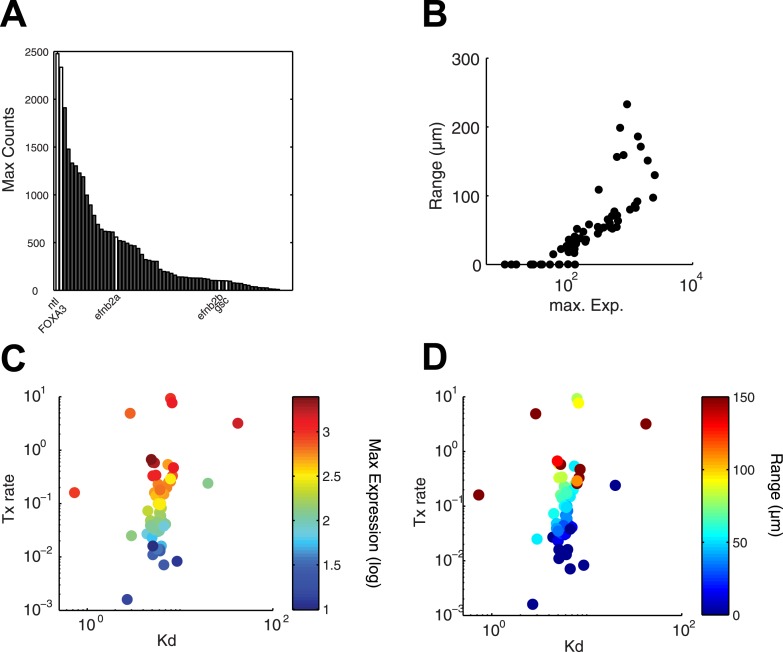
Figure 7. Range of expression correlates with maximal transcription rate.
(A) Bar graph showing the number of counts detected 90 min after injection of 100 nM of recombinant Nodal protein for the 61 Nodal-responsive genes (direct and indirect) identified in the NanoString codeset. Some of the genes used in this study are highlighted. (B) Scatter plot comparing maximal expression and simulated range. Highly expressed genes tend to have a longer range of expression. (C and D) Scatter plots comparing fitted Kd and maximal transcription rate (Tx rate) in relation to maximal expression (C) and in relation to simulated spatial range of expression (D). Most Kd values remain in a narrow range while transcription rates spread over several orders of magnitude.

