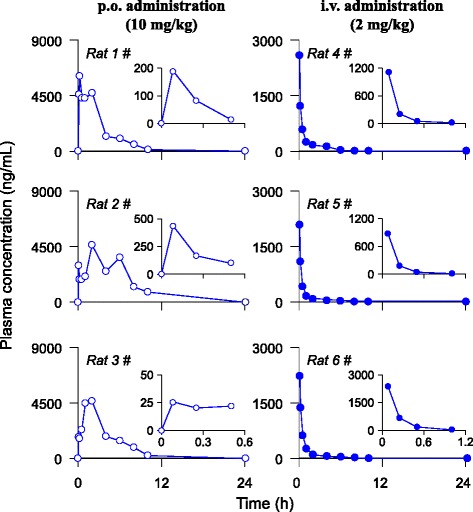
Figure 5.

Plasma concentration-time profiles of total type of galangin after a p.o. dose (10 mg/kg) or an i.v. dose of galangin (2 mg/kg) in rats. The right and smaller inserts show the plasma concentration-time profiles of free type of galangin after the same dosing.
