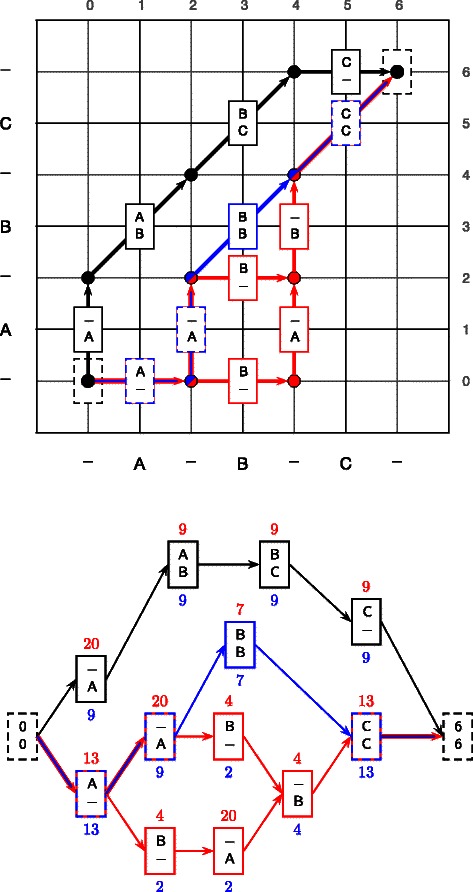
Figure 10.

The minimum-risk path under the C-based loss function (blue) may not be the same as that under the C +-based loss function (red). Column frequencies are shown in blue below each column, and the p C+ marginals shown in red above (as frequencies from a total of 20 samples). In this case, there are two equivalent paths with the same C +-score.
