
Figure 11.
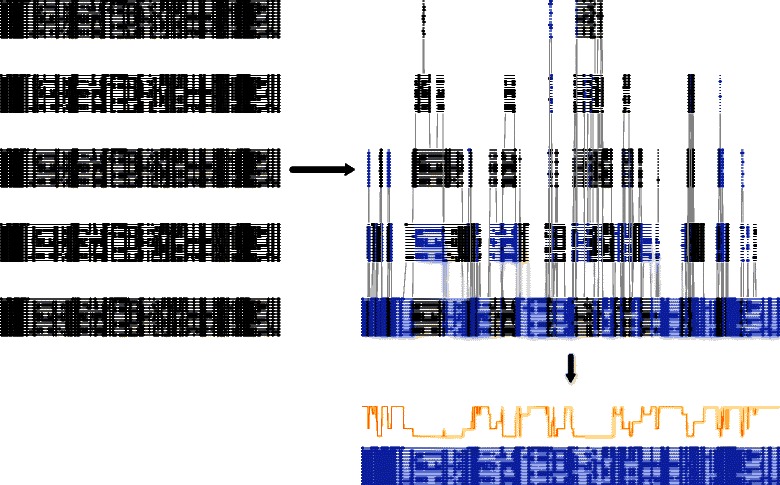
A collection of alignment samples can be combined into a DAG structure, and a summary algorithm generated using efficient algorithms. The graph can be visualised by vertically ordering columns based on the longest path length to the end of the DAG (as shown above). Each path represents a valid combination of the columns in the input alignments, with valid recombinations shown as grey lines in the above figure. The maximum a posteriori or minimal-risk path can then be found efficiently using linear-time algorithms, yielding a single summary alignment (shown in blue) that accounts for the uncertainty in the alignment set, and can be annotated with posterior probabilities for each column (shown in orange).