
Figure 12.
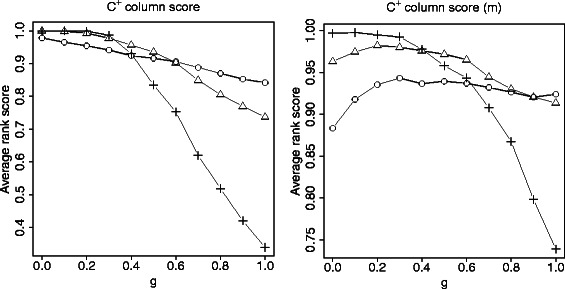
Accuracy as a function of the g parameter. Accuracy on the simulated datasets under the (left) and (right) measures as a function of the g parameter for low (∘), medium (△) and high (+) indel rates.
Official websites use .gov
A
.gov website belongs to an official
government organization in the United States.
Secure .gov websites use HTTPS
A lock (
) or https:// means you've safely
connected to the .gov website. Share sensitive
information only on official, secure websites.
Accuracy as a function of the g parameter. Accuracy on the simulated datasets under the (left) and (right) measures as a function of the g parameter for low (∘), medium (△) and high (+) indel rates.