
Figure 14.
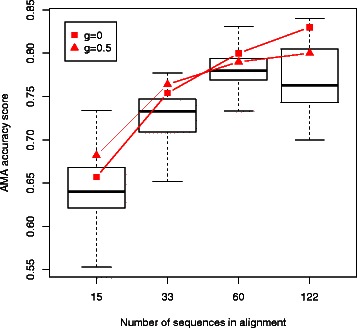
Accuracy as a function of the g parameter. Distribution of alignment accuracy scores for the OXBench datasets. Minimum-risk summary alignments shown in red, for g=0 and g=0.5. The summary alignments are generally more accurate than the majority of samples, and this remains the case as the number of sequences is increased.