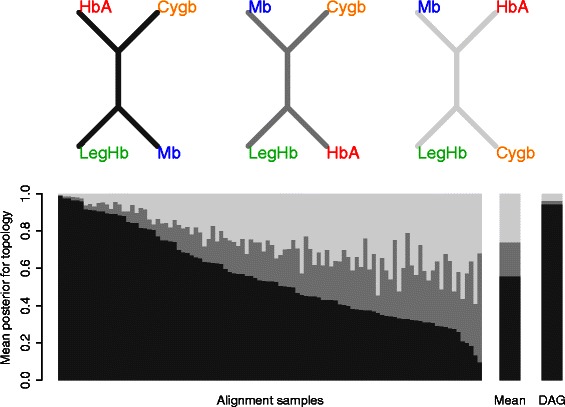
Figure 16.

Posterior probabilities for three possible topologies, computed on individual alignment samples (bottom left), as well as marginalising over the alignments within the DAG (bottom right).Top panel: The three unrooted topologies for the four globin sequences discussed in the main text, ordered according to the posterior probability according to StatAlign (left to right, descending in probability). The leghaemoglobin sequence is taken from L.luteus, and all others from H.sapiens. Bottom panel: Posterior probabilities computed on individual alignment samples (left), and by marginalising over all alignments contained within the DAG (right). Bars in the lower panel are colour-coded according to the shading of the tree topologies in the top panel, and ordered according to the probability of the first topology. Also shown is the mean of the probability vectors computed on the individual alignment samples (right).
