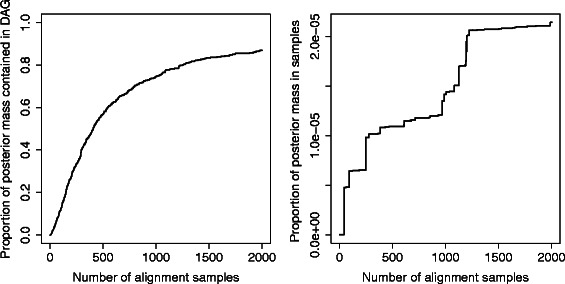
Figure 9.

The proportion of the posterior mass contained in paths through the DAG increases rapidly with the number of samples. For the pairwise example discussed in the text, the proportion reaches in the order of 10- 15% of the total posterior mass with just 100 samples, increasing to over 80% after including 2000 samples (left panel). In contrast, the proportion of posterior mass contained within the individual samples is very small (right panel).
