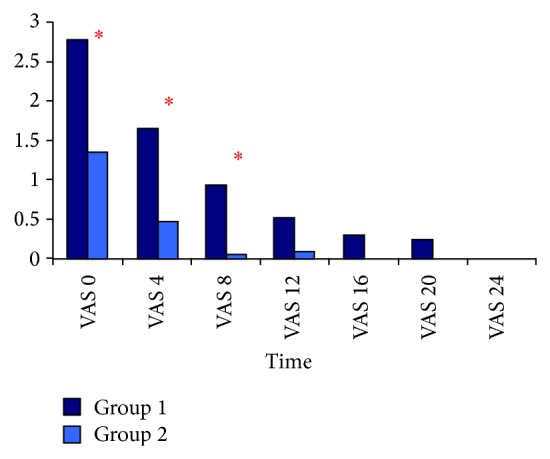
Figure 3.

Comparison of VAS values between groups; ∗ P < 0.05. Group I: general anesthesia, Group II: combined general anesthesia and HTEA with levobupivacaine, VAS: visual analog scale, VAS 0: arrival in the intensive care unit, VAS 4: 4 hours after arrival in the intensive care unit, VAS 8: 8 hours after arrival in the intensive care unit, VAS 12: 12 hours after arrival in the intensive care unit, VAS 16: 16 hours after arrival in the intensive care unit, VAS 20: 20 hours after arrival in the intensive care unit, and VAS 24: 24 hours after arrival in the intensive care unit.
