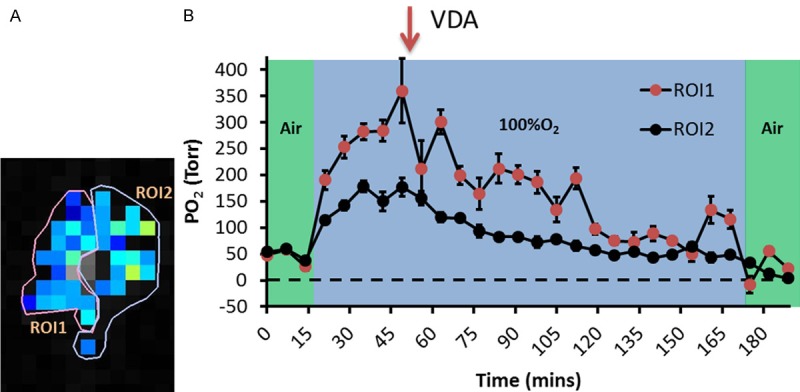
Figure 5.

Intra-tumoral heterogeneity of response to O2 breathing and OXi8007. A. Two ROIs were identified as more and less responsive in the tumor presented in Figure 4. B. Mean pO2 of each region revealing differential dynamic response. Error bar representing standard error is used to demonstrate the spread of pixel pO2 values within ROIs.
