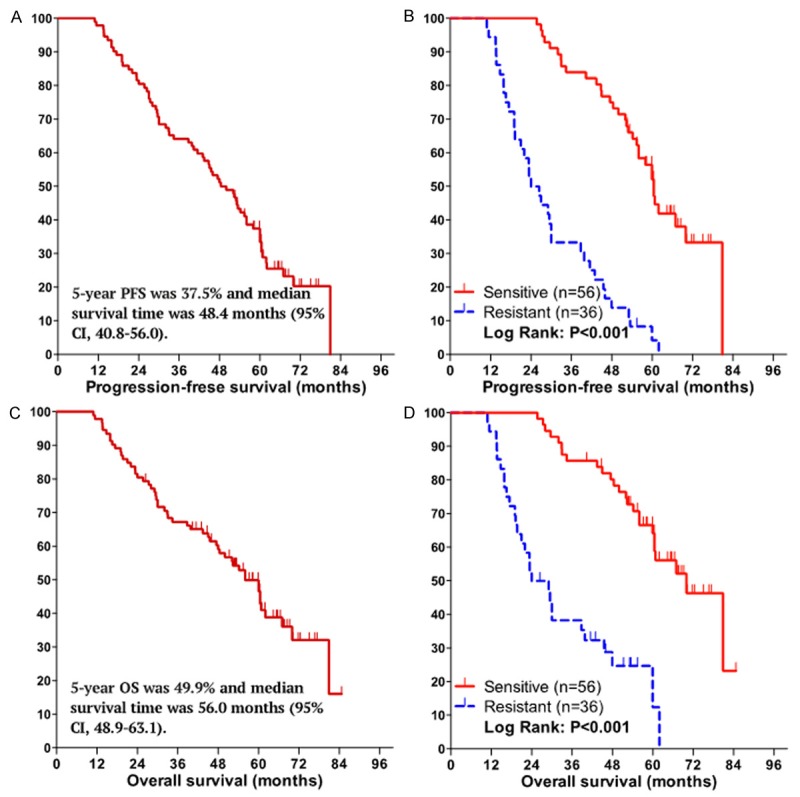
Figure 2.

Kaplan-Meier curves for progression-free survival (PFS) and overall survival (OS) of the 92 patients with EOC. PFS curve (A) and OS curve (C) for all the patients, the 5-year survival rate and median survival time for PFS and OS are shown in figures. Patients in the chemotherapy sensitive group had a prolonged PFS (B) and OS (D) compared to the chemotherapy resistant group: median PFS, 60.5 (95% CI, 57.2-63.8) vs 24.0 (95% CI, 18.6-29.4) months, P < 0.001; median OS, 70.0 (95% CI, 59.5-80.5) vs 24.0 (95% CI, 15.1-32.9) months, P < 0.001, respecatively.
