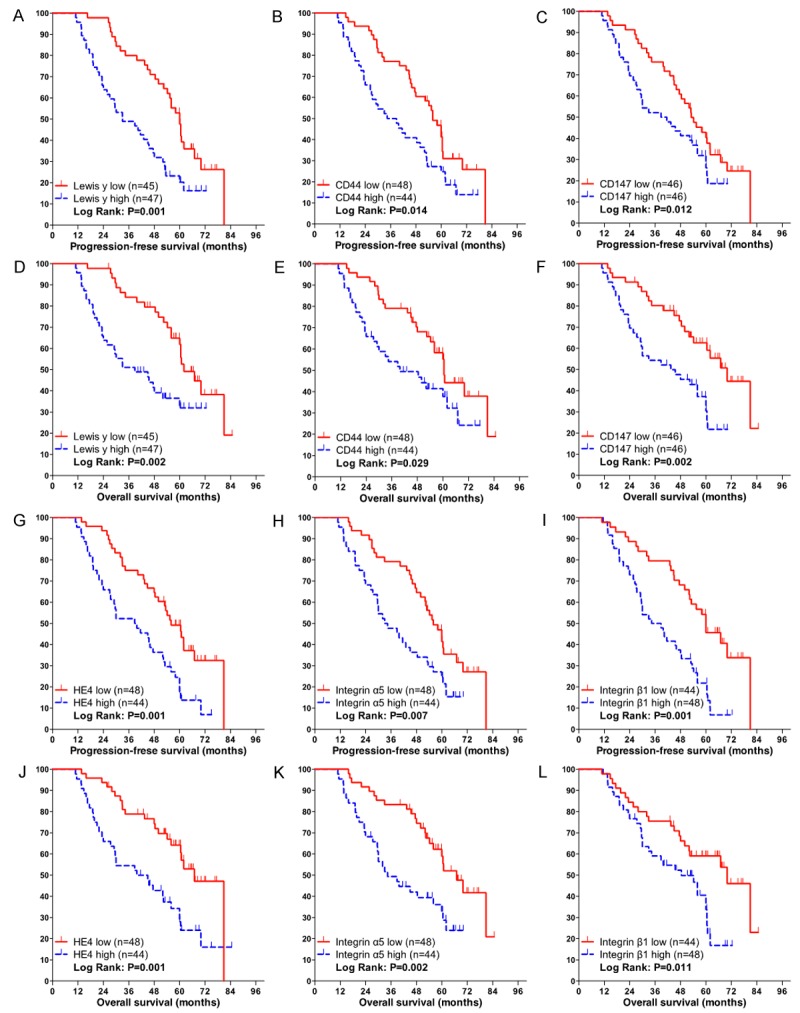
Figure 3.

Kaplan-Meier curves for progression-free survival (PFS) and overall survival (OS) according to IHC markers. PFS and OS according to the low and high expression of (A, D) Lewis y, (B, E) CD44, (C, F) CD147, (G, J) Human epididymis protein 4 (HE4), (H, K) integrin α5, (I, L) integrin β1.
