
Figure 3.
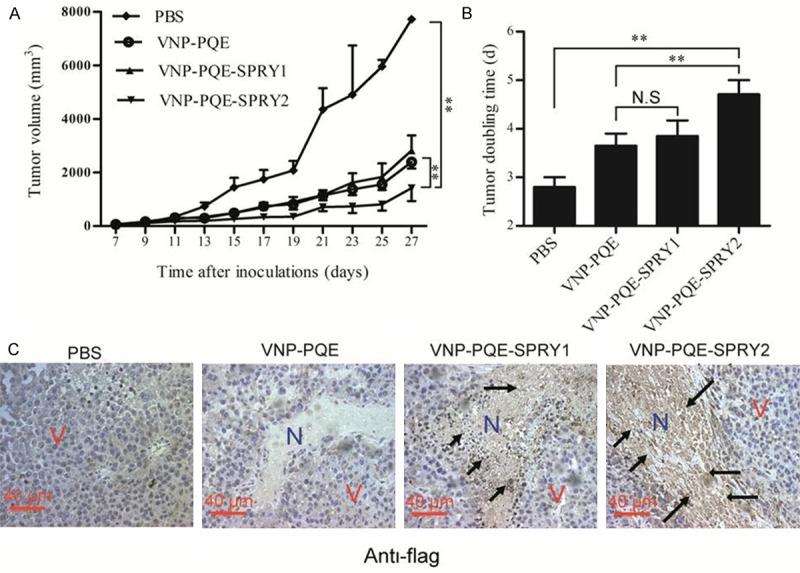
In vivo evaluation of therapeutic efficacy of the recombinant Salmonella. A. Tumor growth curves of groups as indicated. B. Tumor doubling time (time for a tumor to double in volume) of different groups. Data are presented as mean ± SD, *p < 0.05, **p < 0.01 (n = 8 mice), N.S: NS: not significant. C. Detection of the expression of recombinant proteins in the sections of tumor tissues through immune-histochemical studies. N represents necrotic tumor area, and V represents vital tumor cells, black arrows, positive cells.