Figure 2.
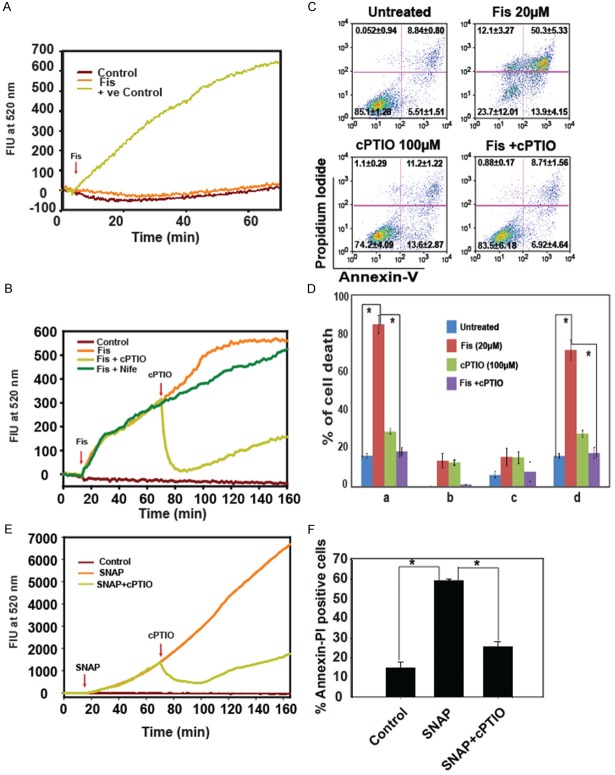
Fisetin induces reactive nitrogen species to induce cell death. (A) Figure shows generation of reactive oxygen species in response to fisetin as measured with fluorescence dye DCF-DA. Note that there was no ROS generation in fisetin treated cells. H2O2 was used as the positive control. (B) DAF-FM (sensor dye of NO) stained fisetin treated cells showing significant increase in NO as compared to control cells. cPTIO used as NO inhibitor shows attenuation of NO production. (C) Measurement of apoptotic death in fisetin treated cells in the presence and absence of the NO inhibitor cPTIO as measured by phosphatidylserine exposure, shows inhibition of cell death in the presence of cPTIO. The upper right quadrant represents both annexin and PI positive cells (late apoptotic), the lower right quadrant shows only annexin positive cells (early apoptotic), the upper left quadrant only PI positive cells and lower left is unstained cells. (D) Bar graph shows distribution of cells as achieved by AnnexinV staining shown in (C). Data are ± SEM, n = 4, *p < 0.05. (E) Cells stained with NO sensor dye DAF-FM shows an increase in NO in presence of NO generator SNAP. The cPTIO was used as a NO scavenger. (F) The bar graph represents cell death in the presence of SNAP and cPTIO. Data are ± SEM, n = 3, *p < 0.05.

