
Figure 1.
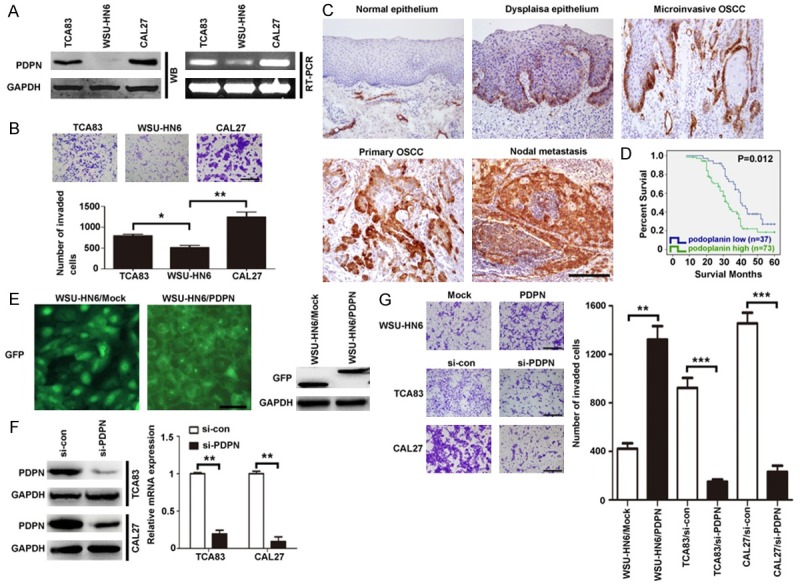
Podoplanin expression is positively associated with the invasiveness of OSCC cells both in vitro and in vivo. A. Expression of podoplanin in three OSCC cell lines. Equal amounts of proteins and cDNA from three OSCC cell lines were evaluated by western blot and RT-PCR. GAPDH was used as control. B. Invasion ability of three OSCC cell lines was accessed by transwell assay. 1 × 10⁴ cells were seeded on the upper chamber and incubated for 48 h. Cells that invaded the membrane were then stained and counted. Scal bar = 400 μm. C. Representative photographs of immunostaining for podoplanin in normal epithelium, dysplasia epithelium, microinvasive OSCC, primary OSCC and nodal metastasis. Scal bar = 200 μm. D. Kaplan-Meier plots of podoplanin expression in 110 cases of OSCC patients. Overall survival rate was performed by log-rank test (immunoreactivity scores < or = 6 was ascribed to be low podoplanin expression, immunoreactivity scores > or = 7 was ascribed to be high podoplanin expression). P < 0.05 indicated significant differences between two groups. E. WSU-HN6 cells were stably transfected with pCMV6-Entry empty vector or pCMN6-AC-GFP vector containing full-length podoplanin. Western blot analysis revealed the expression of GFP-tagged podoplanin and control vector in WSU-HN6. GAPDH was used as control. Scale bar = 50 μm. F. TCA83 and CAL27 cells were treated with PDPN and control siRNA regents. After 24 h and 48 h, the expression of podoplanin was analyzed by qRT-PCR and western blotting, respectively. GAPDH was used as control. G. The invasion ability of each cell line was evaluated by transwell assay. WSU-HN6 with overexpressed podoplanin and TCA83 and CAL27 cells with podoplanin knockdown were subjected to the transwell assay. Scale bar = 400 μm. Experiments in A, B, F and G were performed in triplicates (n = 3). Error bars indicate SD; significance level as indicated: *P < 0.05, **P < 0.01, ***P < 0.001.