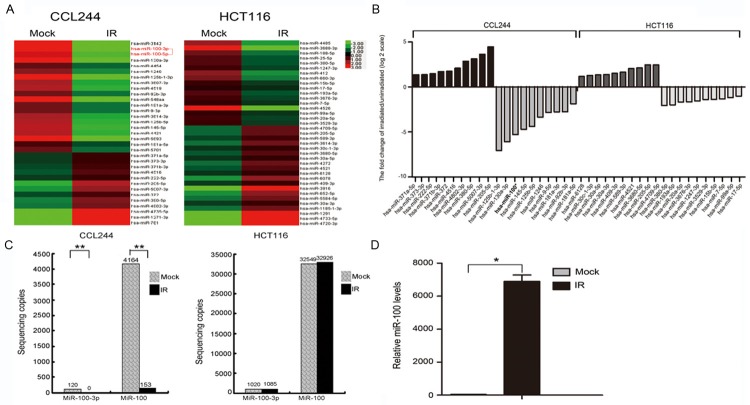
Figure 2.
miRNA sequencing results of colon cancer cells before and after X-ray irradiation. A. miRNA expression profiles of CCL-244 and HCT116 cells before and after X-ray irradiation determined by miRNA sequencing; the heatmap was generated with miRNAs whose expressions were down- or up-regulated more than 2-fold compared to controls. B. Ten miRNAs were differentially expressed in CCL-244 or HCT116 cells after exposure to 8-Gy X-ray irradiation compared with nonirradiated control cells. The irradiated/nonirradiated expression ratio was expressed as Log2. The bars indicate the means for this experiment. C. Expression of miR-100 in CCL-244 cells before and after exposure to 8-Gy X-ray irradiation (**P < 0.01); expression of miR-100 in HCT116 cells before and after exposure to 8-Gy X-ray irradiation (P > 0.05). D. Quantitative real-time PCR to confirm the expression of miR-100 after transfection and to examine consistency with sequencing results (*P < 0.05).

